
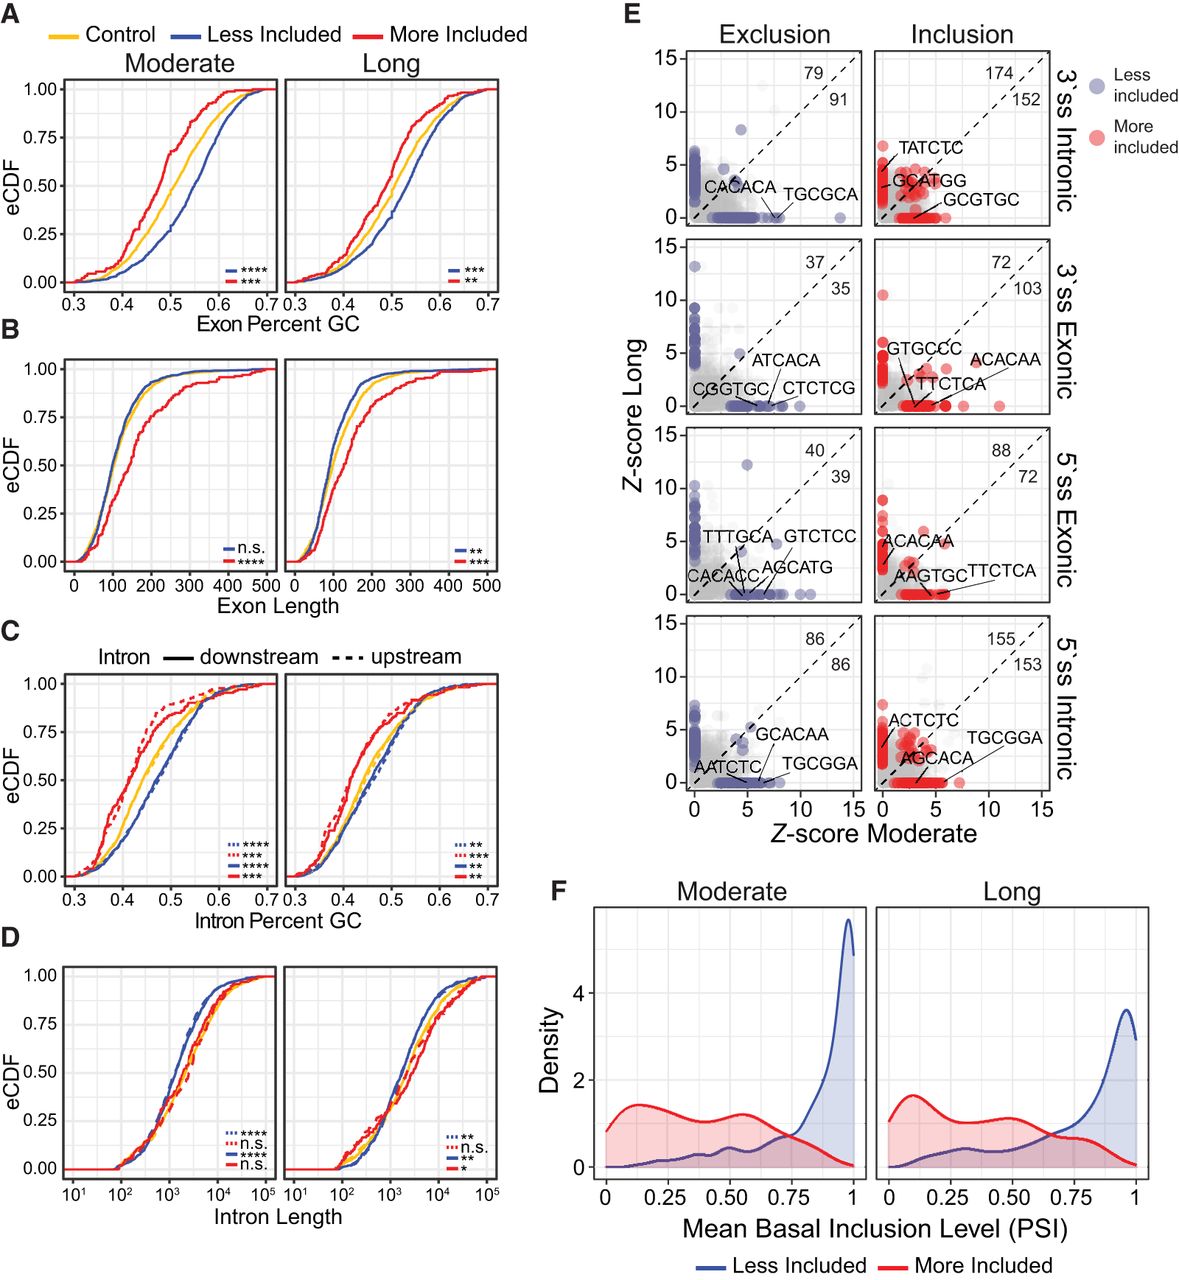
High-confidence activity-dependent exons are enriched in genomic features. (A) Cumulative distribution function of exon GC content for high-confidence KCl-dependent exons and control, expression-matched alternative exons that are not responsive to KCl at each duration of treatment. Blue and red designate KCl-dependent exons that become less or more, respectively, included upon KCl treatment. A Kolgomorov–Smirnov test (KS) was performed to assess the similarity of the KCl and control distributions, and statistical significance was considered P < 0.05. (n.s.) P > 0.05, (*) P < 0.05, (**) P < 10−3, (***) P < 10−6, (****) P < 10−9. (B) As above, looking at exon length. (C) Cumulative distribution function of intronic GC content for high-confidence KCl-dependent exons and control, expression-matched alternative exons that are not responsive to KCl at each duration of treatment. Dashed line represents upstream (5′) introns; solid line, downstream (3′) introns. Blue and red designate introns adjacent to KCl-dependent exons, which become less or more, respectively, included upon KCl treatment. A KS test was performed to assess the similarity of the KCl and control distributions between upstream and downstream introns with statistical significance considered P < 0.05. (n.s.) P > 0.05, (*) P < 0.05, (**) P < 10−3, (***) P < 10−6, (****) P < 10−9 (D) As above, looking at intron length. (E) Enrichment of 6-mers in less included (left) and more included (right) KCl-dependent alternative exon sets relative to control alternative exons unresponsive to KCl treatment. Enrichments are performed using sequence of shallow (100 bp) upstream and downstream introns, as well as exons. Number of significantly enriched k-mers (Fisher's exact P-value > 0.05) for moderate and long KCl exon sets are noted in top right corner. The top-ranking k-mers that contain a motif for RNA-binding proteins previously implicated in KCl-regulated splicing in neurons are indicated on plot: UGC (SRRM4), CA-rich sequences (HNRNPL/LL), UC-rich sequences (PTBP1), and GCAUG (RBFOX2). A full table of significantly enriched k-mers and their P-value is given in Supplemental Table S6. (F) Density plot of mean basal inclusion level (PSI) across all data sets of high-confidence KCl-dependent exons prior to KCl stimulation. Blue and red designate exons that become less or more, respectively, included upon KCl treatment.


