
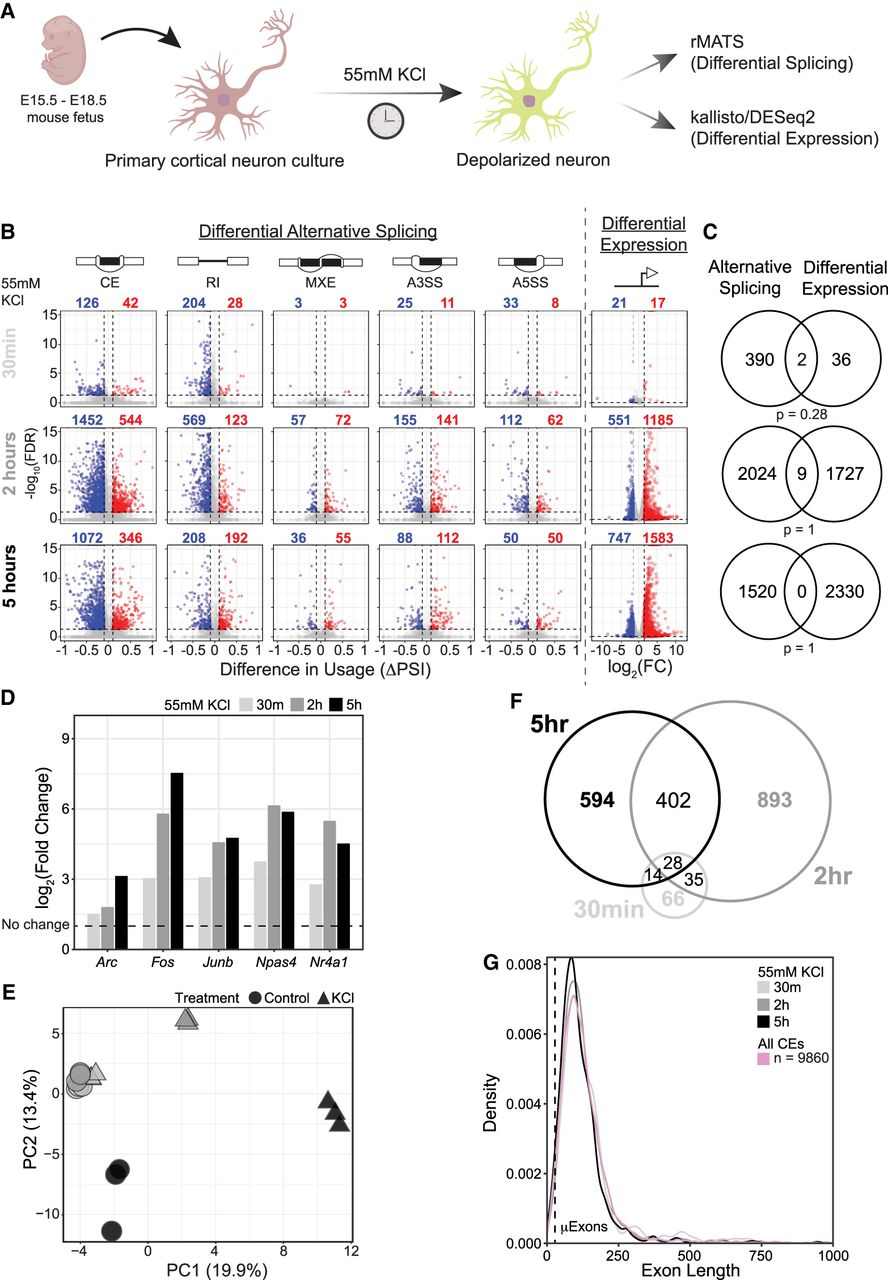
KCl induces widespread changes in alternative splicing in mouse primary cortical neurons. (A) General experiment workflow for depolarization of mouse primary neurons using KCl. (B) Volcano plots of global differential splicing and expression changes following KCl treatment in primary cortical neurons from Maze et al. (2015). Differential alternative splicing is presented as change in percentage spliced in (ΔPSI) between KCl-treated and untreated samples for each treatment duration. Expression changes are reported as log2 of the fold change (FC) between equivalent comparisons. Alternative splicing event types analyzed include the following: (CE) cassette exon, (RI) retained intron, (MXE) mutually exclusive exons, (A3SS) alternative 3′ splice site, and (A5SS) alternative 5′ splice site. Splicing events were considered significant with an FDR < 0.05 and |ΔPSI| > 10%. Differentially expressed genes were considered significant with an FDR < 0.05 and |log2FC| > 1.5. Significant differential splicing events and differentially expressed genes are highlighted in red (more included or upregulated) or blue (less included or downregulated). (C) Venn diagrams of overlap between differentially expressed genes and genes containing a differentially spliced event (all event types). Significance of overlap was determined using a hypergeometric test. (D) Differential expression of immediate early genes (IEGs) upon KCl treatment in Maze et al. (2015). (E) Splicing PCA of KCl-treated and untreated primary neurons from Maze et al. (2015). Individual samples are plotted with treatment groups denoted by shape and time point by color. Principal components are calculated using percentage spliced in (PSI) of 21,618 alternative exons (0.1 < PSI < 0.9) quantified at all time points and treatments. (F) Euler plot of genes containing differentially spliced CEs in response to each duration of KCl treatment from Maze et al. (2015). (G) Smoothed density distribution of exon lengths across differentially spliced alternative exons for each duration of KCl treatment in Maze et al. (2015). Pink line denotes CEs (0.1 < PSI < 0.9; n = 9860) regardless of KCl dependence quantified in all samples. Dashed line denotes the upper size limit of μexons (28 nt).


