
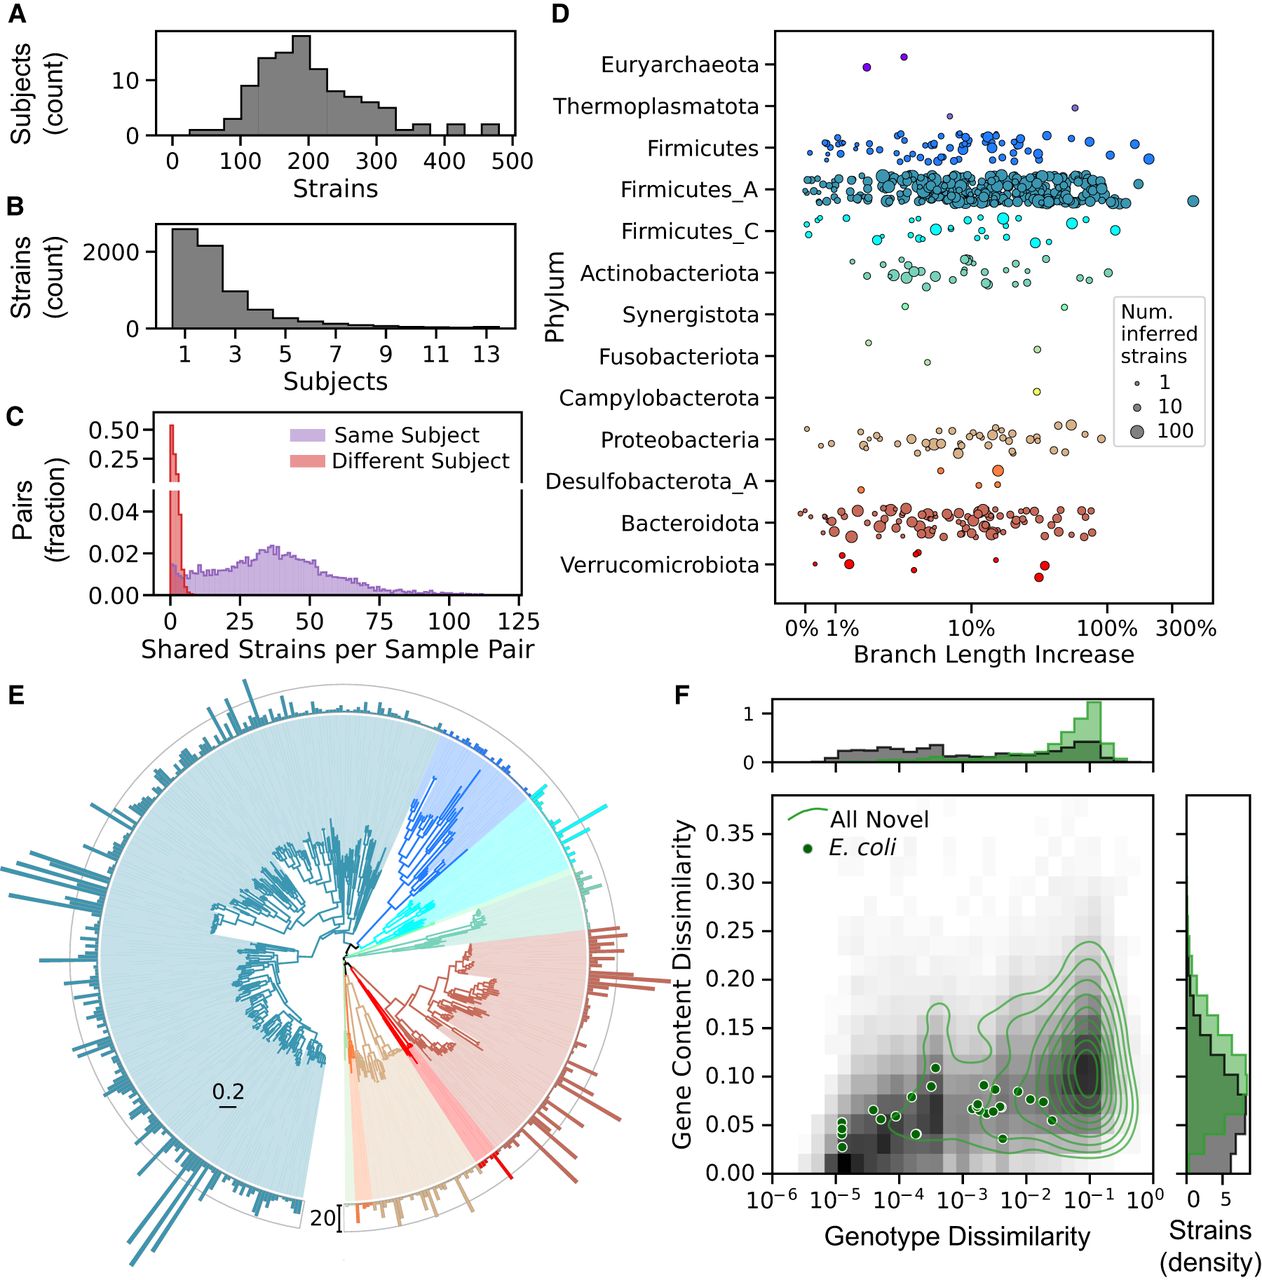
Strain diversity in the HMP2 metagenome collection. (A,B) Histograms reflecting the distribution of inferred strains of any species across subjects in the HMP2 metagenome collection. (A) Number of strains for 106 subjects, summed over all samples (median of 11 samples per subject; IQR: 9–14). Most subjects harbor between 100 and 300 inferred strains (median of 191.5). (B) Number of subjects in which each strain was detected. Only strains found in two or more samples are tallied. Most strains (67%) were found in just one or two subjects. (C) Number of strains shared in any pair of samples from the same (purple) or different (red) subjects. Pairs of samples from different subjects shared a mean of just 0.7 strains. (D) A substantial increase in strain diversity was captured when including inferred strains. Diversity was quantified based on total branch length in a hierarchical clustering (UPGMA) of all SNP genotypes, and the increase was measured as the change in branch length relative to a tree with only reference strains. Points represent individual species and are colored by phylum, and increasing size reflects a larger number of inferred strains. Five species with fewer than three inferred strains had a small decrease in branch length when inferred strains were included; one of these is excluded from the plot, left of the x-axis limit. (E) Taxonomic diversity of 3504 inferred strains of bacteria. The species tree is colored by phylum as in D. Species that had no strains with estimated gene content were omitted, and bars around the outer ring indicate the number of inferred strains (outer ring indicates 20 strains). The branch length scale bar (interior) is in units of substitutions per position. (F) Estimated genotype and gene content dissimilarity from the closest reference genome. Joint (main panel) and marginal distributions (panels above and to the right) are plotted for all high-quality reference (gray background) and inferred (green contours) strains of all species. Gene content dissimilarity of inferred strains is calculated after batch correction (see Methods). Points reflecting each of 28 inferred E. coli strains are also shown. Green contours in the main panel reflect deciles in the 2D kernel density estimator.


