
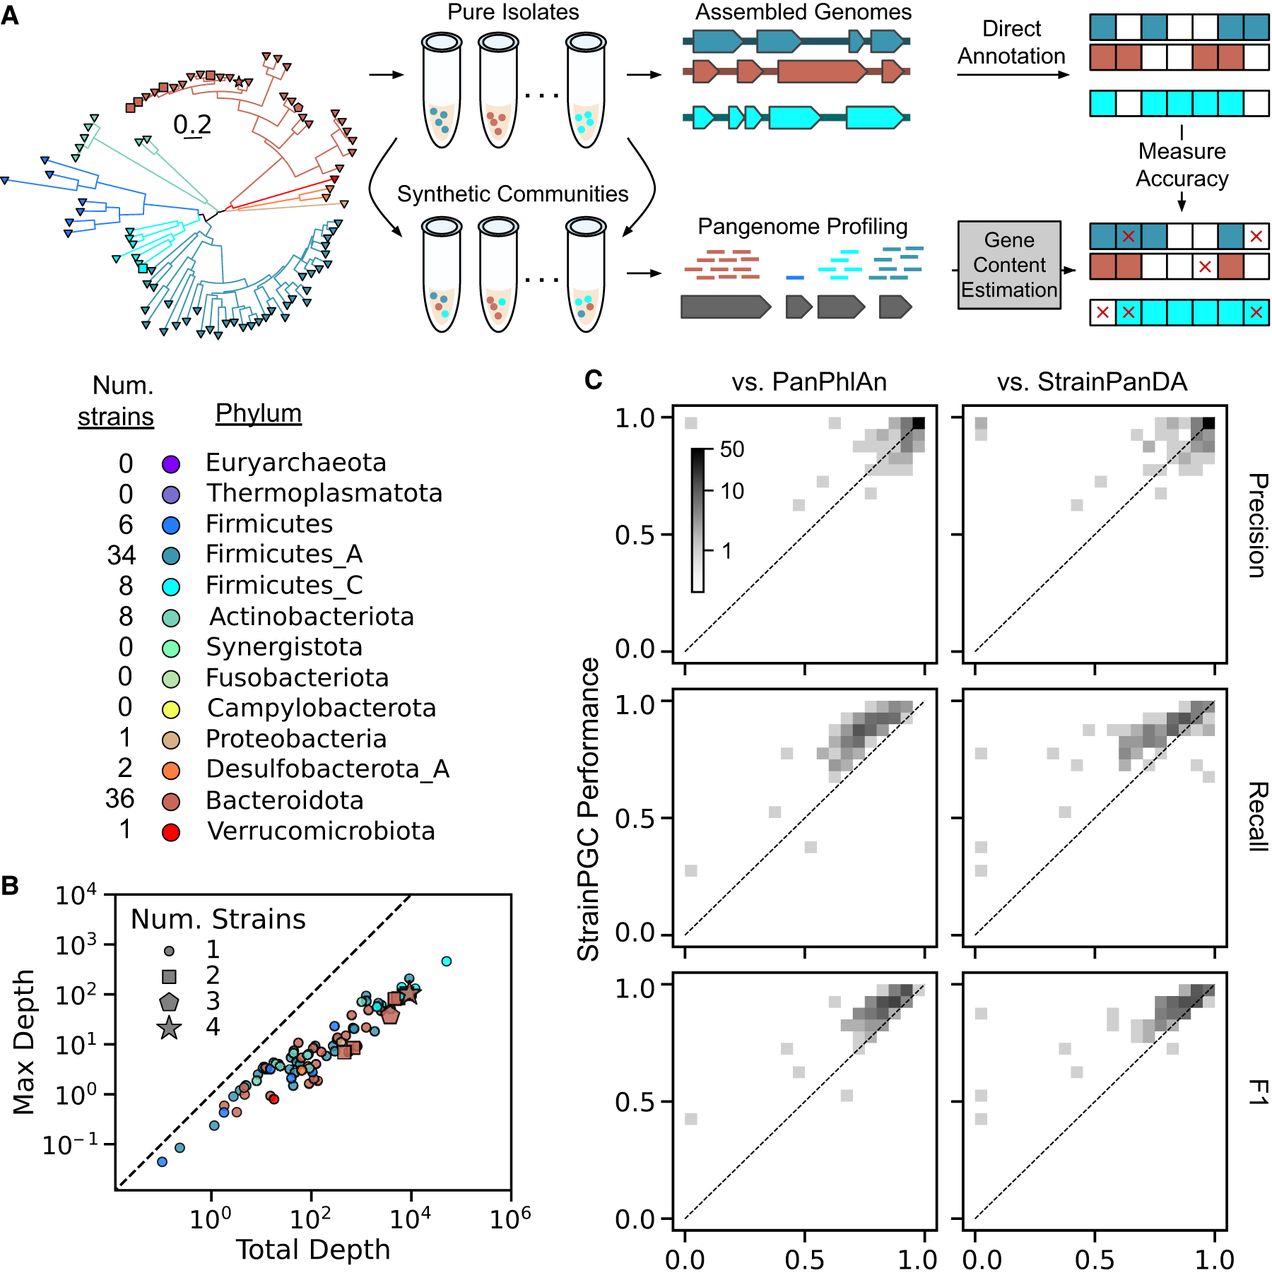
Evaluation of StrainPGC's gene content estimation performance on a highly diverse, synthetic community (Jin et al. 2023). (A) Schematic diagram of our procedure for benchmarking gene content estimates using the hCom2 synthetic community constructed to reflect the species and strain diversity found in human gut microbiomes (Cheng et al. 2022). StrainPGC and alternative tools were applied to pangenome profiles from different samples derived from the synthetic community, and estimates of gene content were compared with high-quality reference genomes for 97 strains. Strains were drawn from 95 species across eight phyla (phylogenetic tree on the left, colored by phylum; scale bar in units of substitutions per position). (B) Core genome depths of 87 detectable benchmarking species span more than two orders of magnitude. Points represent individual species, are colored by phylum, and are placed based on that species’ maximum depth across samples (x-axis) and total depth summed over all samples combined (y-axis). Species are closer to the one-to-one diagonal (dashed line) when the sample with the highest depth contributes more of their total depth. Some species are represented by more than one strain (marker shape). (C) Accuracy of gene content estimates by StrainPGC (y-axis) compared with PanPhlAn (Beghini et al. 2021) and StrainPanDA (x-axes) (Hu et al. 2022), as measured by precision, recall, and F1. All three indices range between zero and one, and higher values reflect better performance. The data are represented as two-dimensional histograms using a gray density scale to represent the number of strains falling in each (x, y) bin; density above the one-to-one diagonal (dotted line) indicates strains in which StrainPGC outperformed the alternative on that index. The relationship between performance and strain sequencing depth or sample number is shown in Supplemental Figure S1.


