
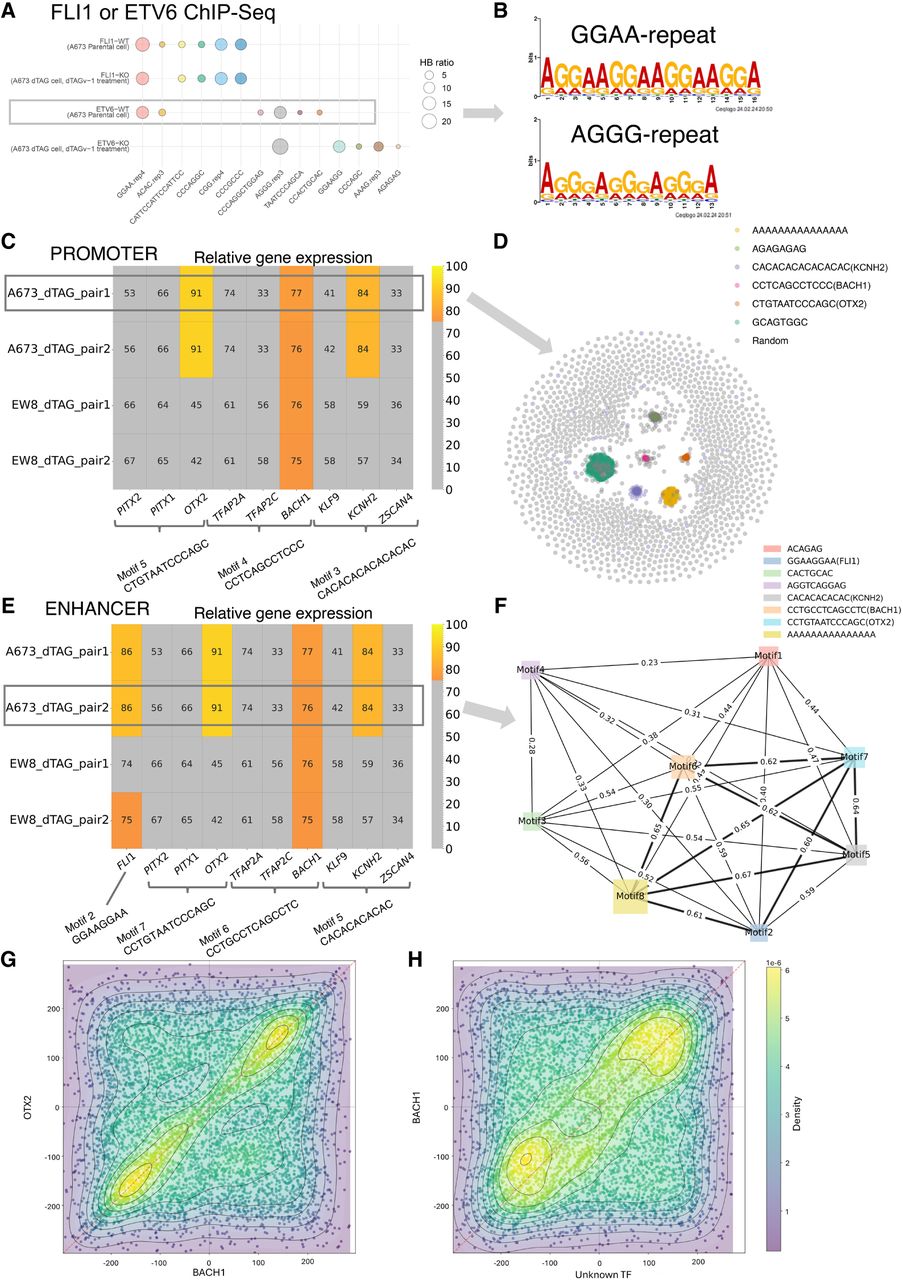
Ewing sarcoma (EWS) data analysis. (A) Motifs identified by KMAP from FLI1 or ETV6 ChIP-seq data. (WT) A673 parental cells, (KO) dTAGV-1 treated ETV6-dTAG cells derived from A673 parental cells. In the motifs, “rep4” means repeat larger or equal to four times, and a similar rule applies to “rep3.” The circle size indicates the Hamming ball ratio. (B) Motif logos of GGAA and AGGG repeats generated from motif k-mers, based on ChIP-seq peaks of the ETV6-WT sample. (C) Expression levels of potential promoter region–associated TFs. Each row is a sample pair, namely, dTAG cells treated with dTAGV-1 (ETV6 degraded) and DMSO (ETV6 intact), in which newly gained promoter regions (ETV6 degraded vs. intact) are used as the input for KMAP. The columns are the potential TFs of the identified motifs. Note that FIMO returns multiple TFs for a single input consensus sequence. For each pair, gene expressions in the corresponding ETV6 degraded sample (dTAGV-1 treated) are ranked, and the ranks are converted to relative expression 0%–100%, in which top 25% genes are colored, and the rest of the genes are gray. The number in each cell shows the relative expression. The motif consensus sequences are obtained from the “A673_dTAG_pair1” pair highlighted by the rectangle. (D) KMAP visualization of k-mers in the promoter region, based on newly gained ChIP-seq peaks (ETV6 degraded vs. intact) from the “A673_dTAG_pair1” pair. (E) Expression levels of potential TFs in enhancer regions. The motif consensus sequences are extracted from the “A673_dTAG_pair2” pair. (F) Co-occurrence network of identified motifs from the “A673_dTAG_pair2” pair. The edge weight indicates the proportion of ChIP-seq peaks that contain both TFs out of all peaks that contain at least one TF. The node size indicates the Hamming ball ratio. (G) Motif positions of BACH1 and OTX2 on enhancer regions (400–600 bp) from “EW8_dTAG_pair2.” Each dot represents a pair of BACH1 and OTX2 occurrences within a single enhancer region. The center of each enhancer region is set as the origin, and motif positions are shown relative to this origin. (H) Motif positions of BACH1 and CCCAGGCTGGAGTGC on enhancer regions (400–600 bp) from “EW8_dTAG_pair2.”


