
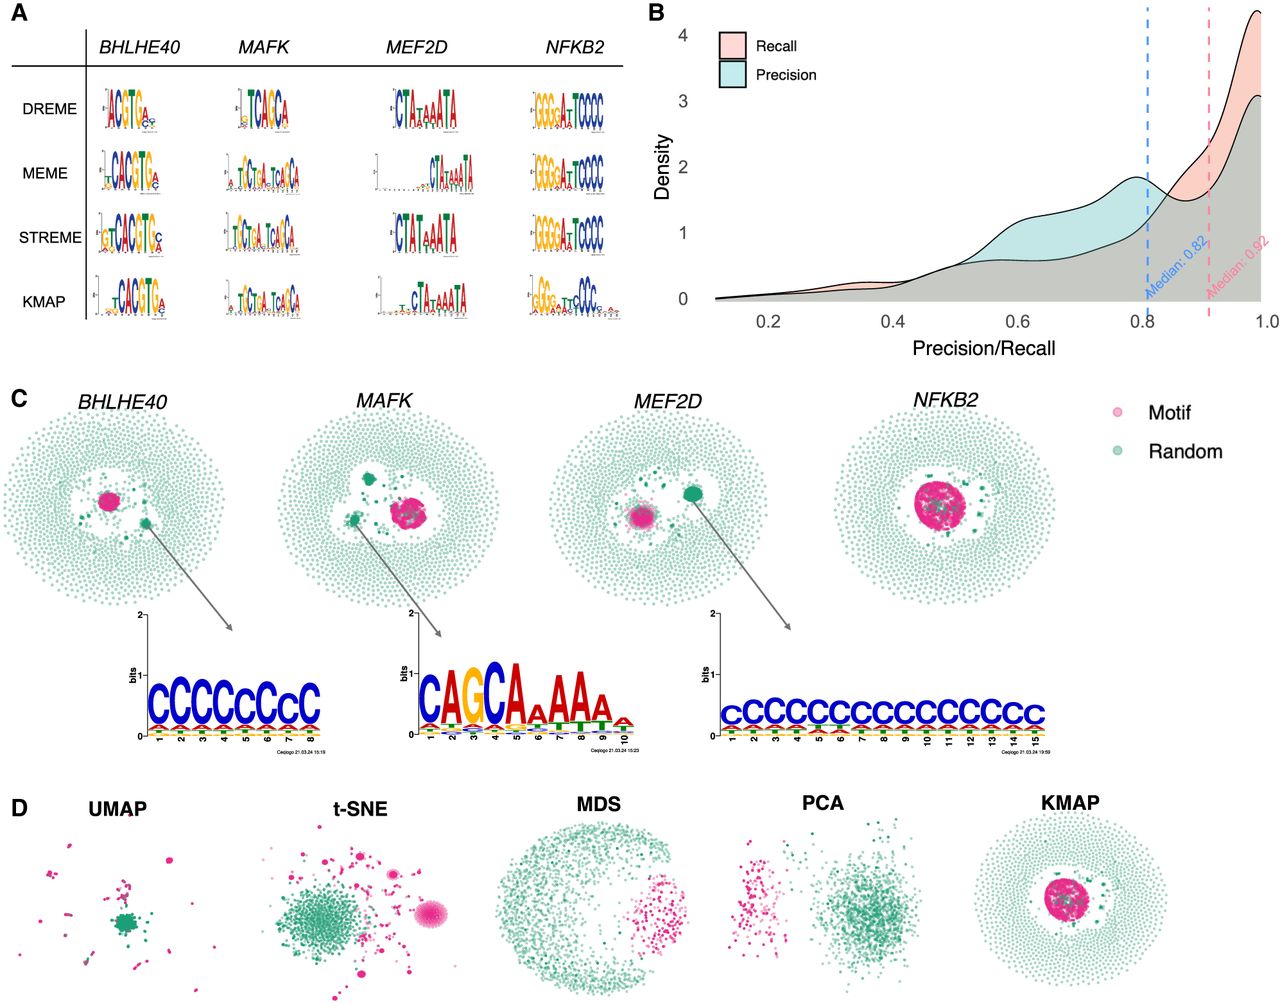
Figure 3.
Benchmark on HT-SELEX data. (A) Motif logos of four example TFs given by DREME, MEME, STREME, and KMAP. (B) Distribution of precision and recall scores between MEME and KMAP. The scores are calculated for 1273 samples (SELEX rounds 3–6), with the corresponding medians highlighted by the dashed vertical lines. (C) KMAP visualizations of example TFs. Motif and random k-mers are highlighted in red and green, respectively. The logos illustrate exemplary secondary motifs of TFs. (D) k-mer visualizations of NFKB2 based on UMAP, t-SNE, MDS, and PCA. KMAP visualization of NFKB2 is highlighted in the rectangle above.


