
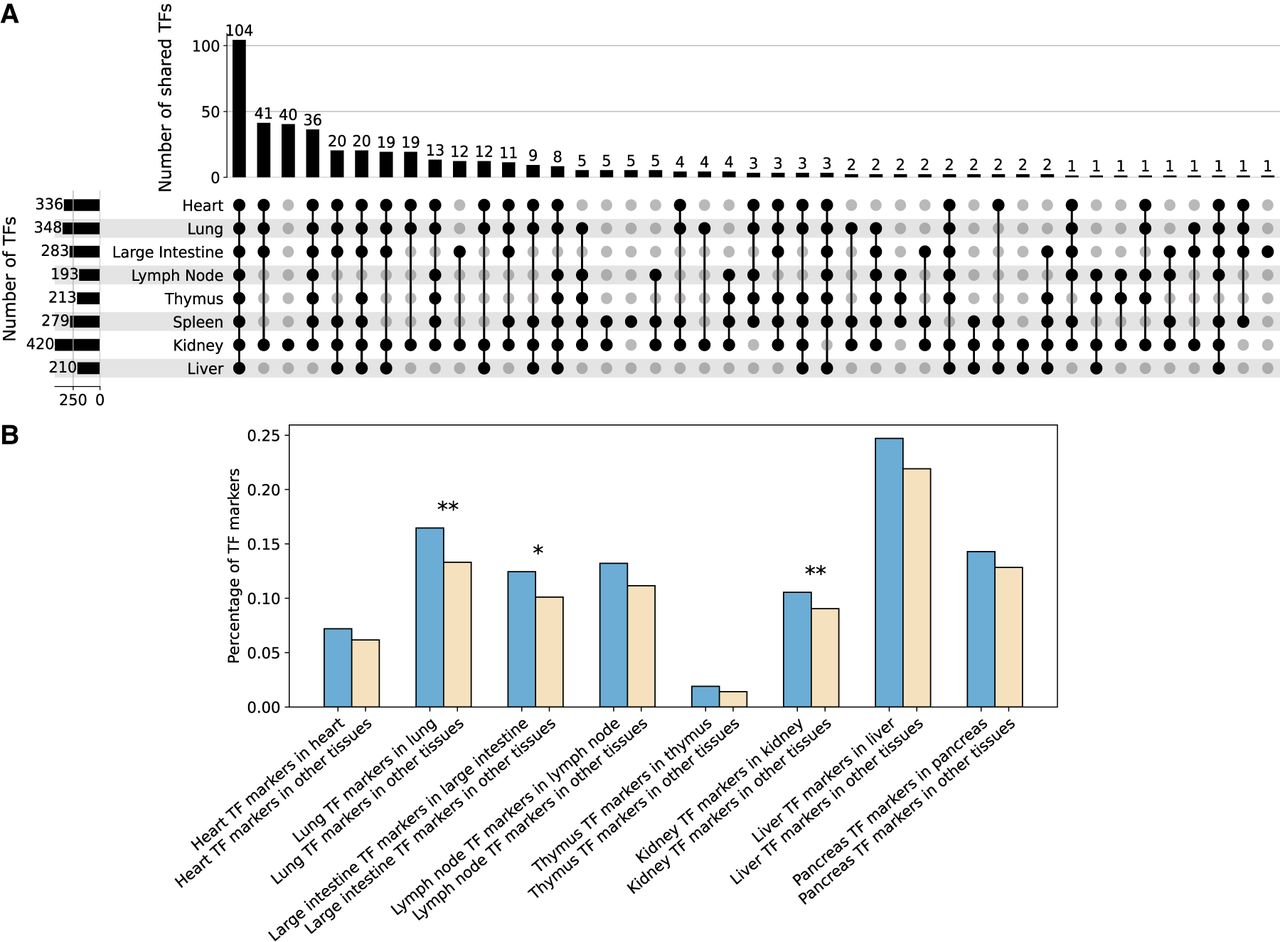
Figure 6.
TFs discovered in different tissues. (A) TF intersections among different tissues. Bars on the left show the number of TFs identified in each tissue, and each bar on the top shows the number of TFs shared among tissues marked by the dots below it. Tissues with fewer than 20 TFs identified are omitted in this figure. The figure was drawn using UpSetR (Conway et al. 2017). (B) The percentage of tissue-specific TF markers in the corresponding tissue (blue) compared with their percentage in the other tissues (light yellow). Significant enrichment in blue groups: (*) P ≤ 0.05, (**) P ≤ 0.01; P-values are evaluated using one-sided Fisher's exact tests.


