
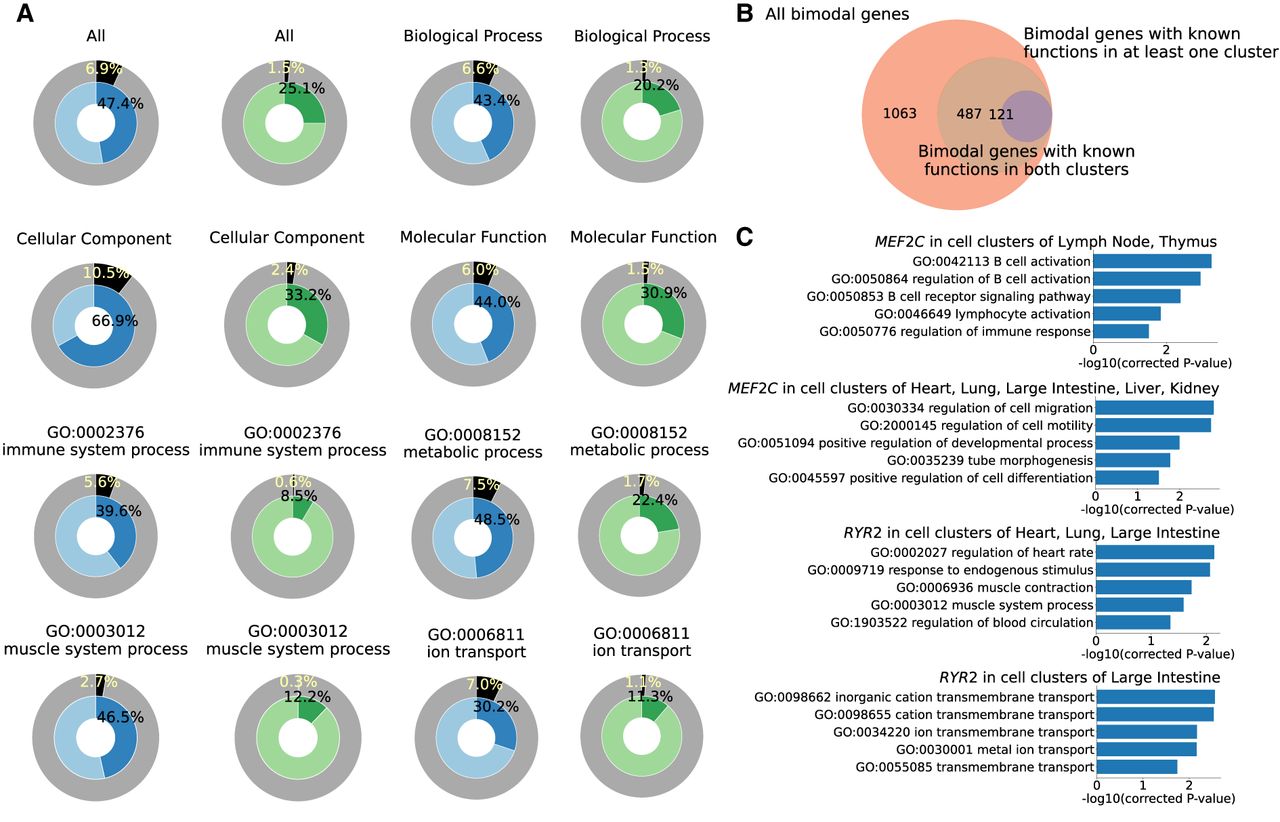
Inference of gene functions in cell clusters. (A) Blue circles show the ratios of known gene functions that are covered by our predictions (recall), and their outside circles indicate the ratios of our predictions in the whole prediction space (all the possible GO assignments). Green circles show the ratios of known gene functions in our predictions (precision), and their outside circles indicate the ratios of known functions in the whole prediction space. Titles indicate child GO terms of which categories are considered. Besides the whole GO space and three main GO branches, some representative GO categories in Figure 3A are also shown here. (B) The number of bimodal genes and the number of bimodal genes for which one or both functions are confirmed. (C) Inferred functions of two genes in different cell clusters.


