
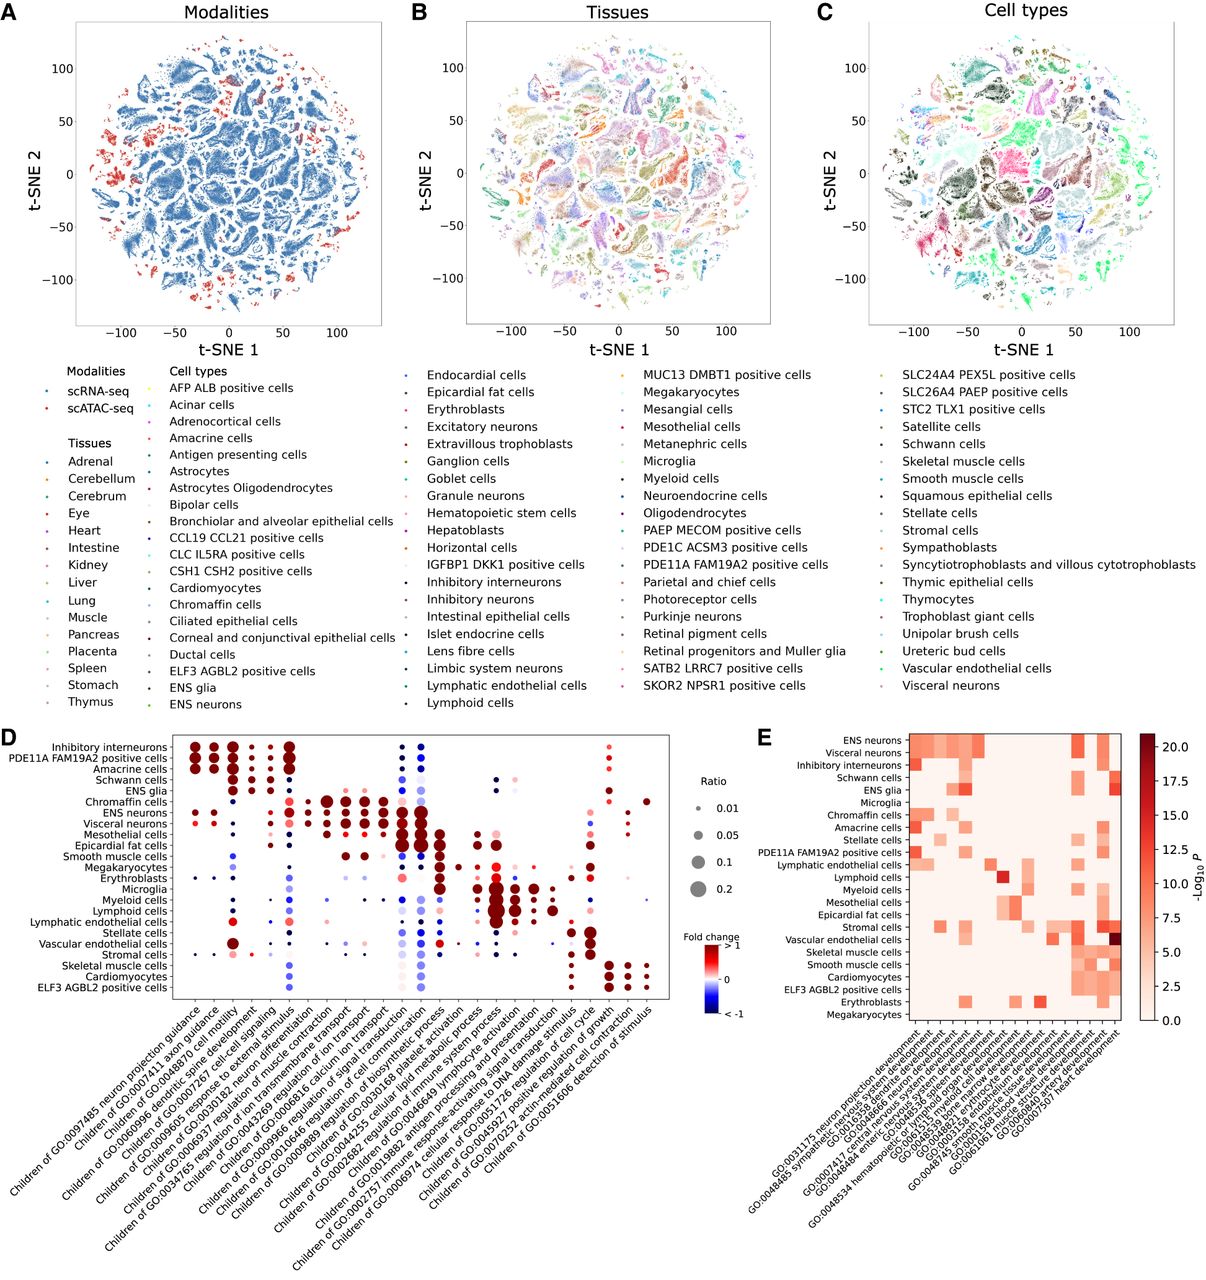
Application of GIANT on the human fetal atlas. (A) Distributions of data modalities in the embedding space. (B) Distribution of tissues in the embedding space. (C) Distribution of cell types in the embedding space. Each point in the plots represents a gene that is colored by its data source. (D) Top GO categories for different tissues. The size of each dot indicates the ratio of child terms of the GO category in all the enriched terms of the tissue. The color of each dot indicates the fold change of the ratio over the average value of ratios in the column. Shown cell types are those with at least 50 GO terms. (E) The enrichment level of different developmental GO terms in the embedding components associated with different cell types shown in D. Colors show the negative logarithm of the corrected P-values.


