
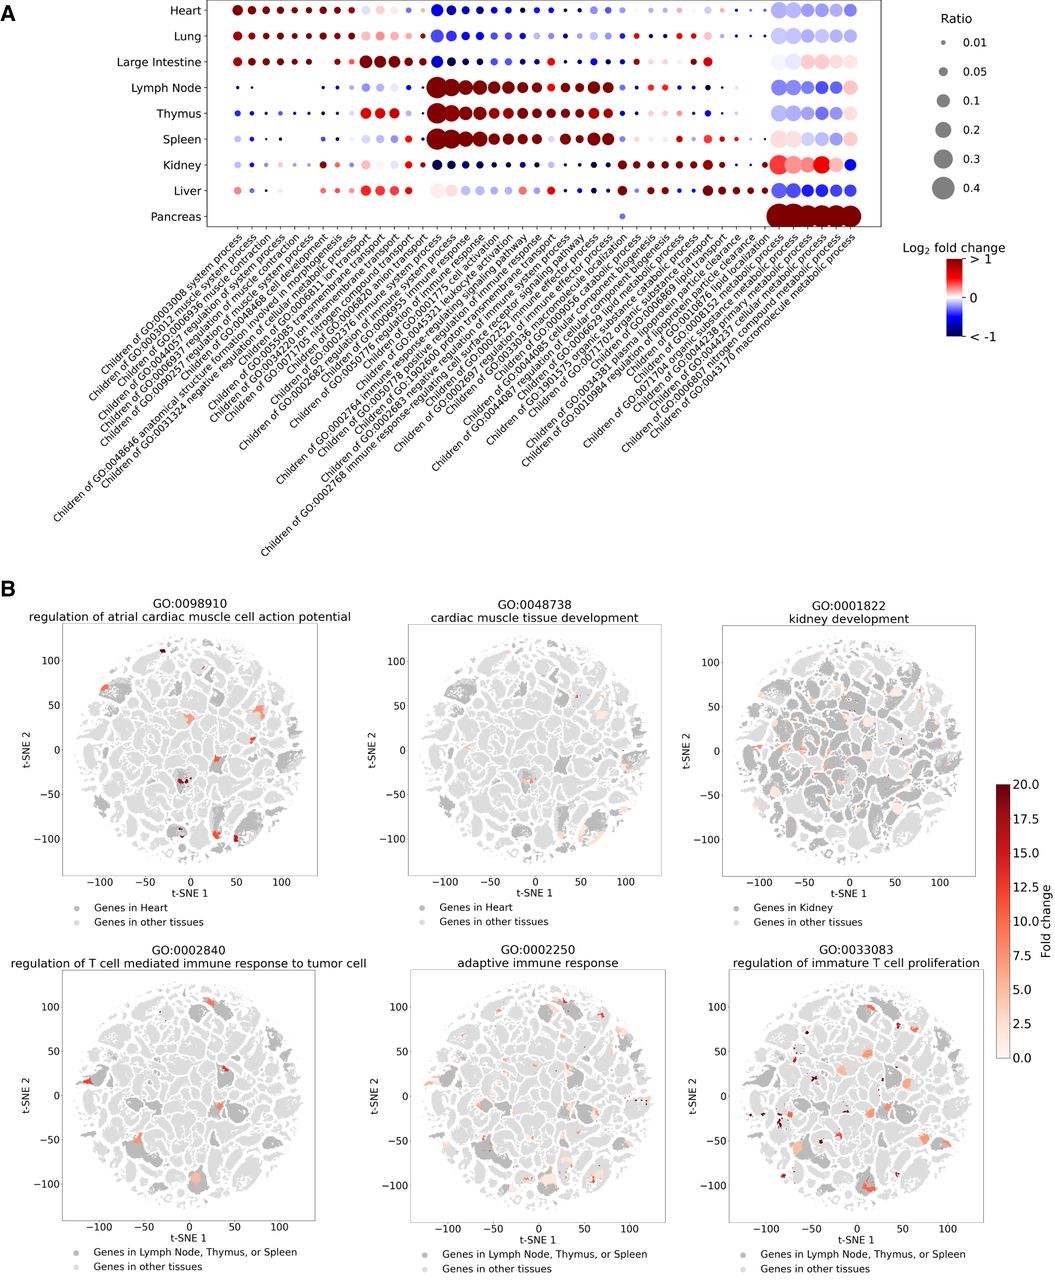
GO terms enriched in different embedding components. (A) The top categories of GO terms enriched in the embedding components associated with different tissues. The size of each dot indicates the ratio of child terms of the GO category in all the enriched terms of the tissue. The color of each dot indicates the fold change of the ratio over the average value of ratios in the column. (B) GO enrichment in different embedding components. Components with the GO term enriched (adjusted P < 0.01) are colored by the enrichment levels of the GO term, and the other components are shown in gray. Genes from tissues related to the GO term are highlighted by dark gray, and genes in the other tissues are colored by light gray.


