
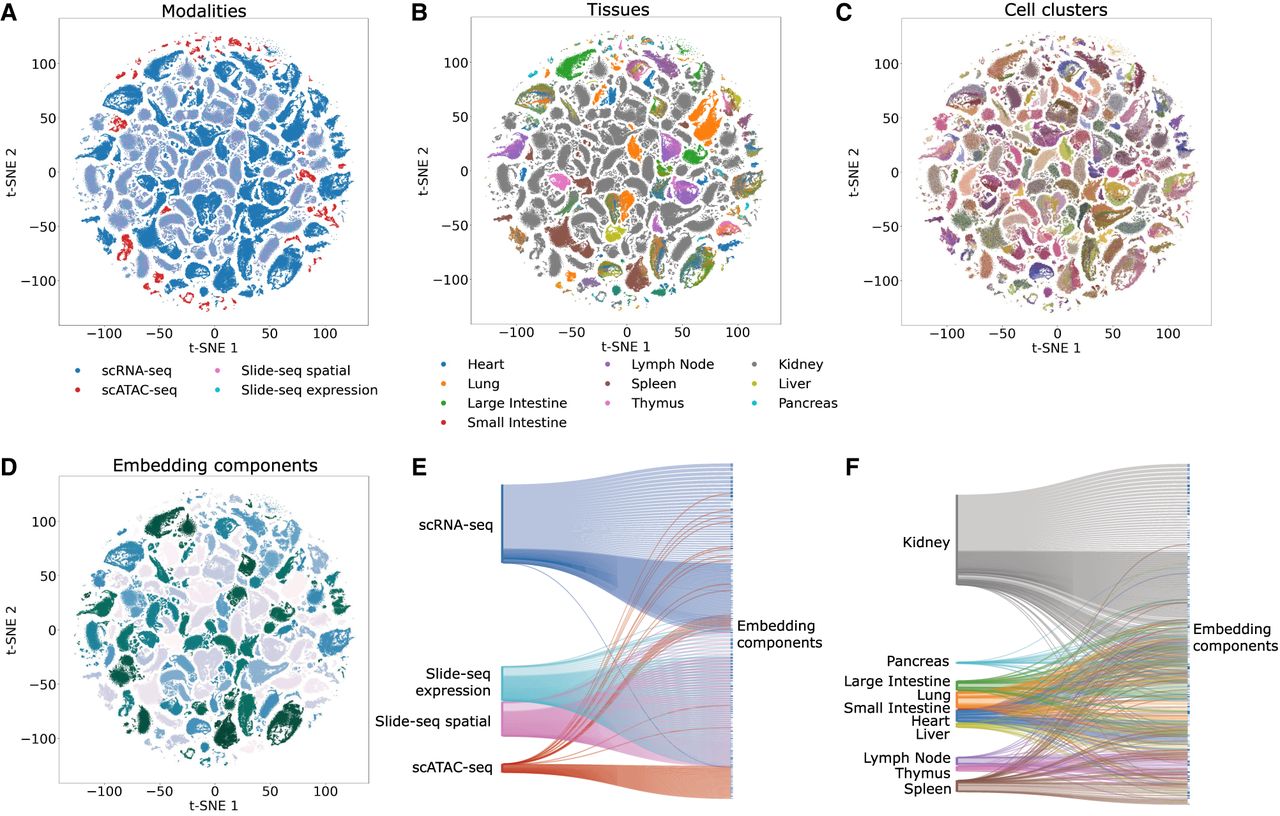
Distributions of data modalities, tissues, and cell clusters in the entire embedding space. (A) Distributions of data modalities in the embedding space; genes are colored by data modalities. (B) Distributions of tissues in the embedding space; genes are colored by tissues. (C) Distributions of cell clusters in the embedding space; genes are colored by cell clusters. (D) The embedding space is split into components; genes in different components are shown in different colors. (E) Cross-clustering between data modalities. (F) Cross-clustering between tissues. As can be seen, genes from several different tissues, and from multiple modalities, are clustered together, allowing for a joint analysis of this large data set.


