
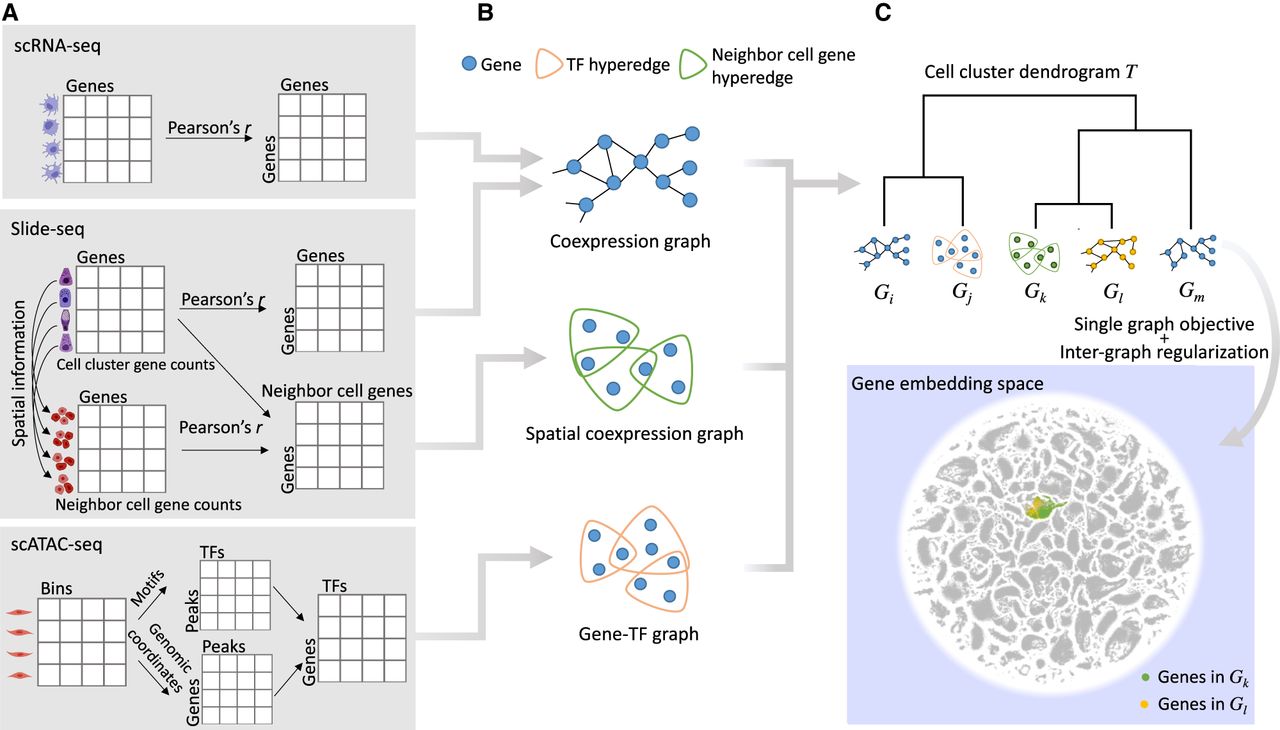
Schematic illustration of the method. (A) Cell clusters are identified from each tissue of each data modality. For each scRNA-seq cell cluster, a gene coexpression matrix is constructed for all the gene pairs in the cell cluster. For each Slide-seq cell cluster, the same gene coexpression matrix is also constructed, and another spatial coexpression matrix is built for gene pairs between the cells of this cell cluster and their neighboring cells. For each scATAC-seq cell cluster, identified peaks from the bin matrix are associated with TFs and genes, which forms a gene–TF matrix. (B) We obtain gene coexpression or coregulation graphs for each of these modalities based on the specific matrices computed in A. (C) A dendrogram for graphs in B is constructed by hierarchical clustering of cell clusters, and a multilayer graph learning algorithm is applied using the tree structure. Each gene in each graph is then encoded into an embedding space, where genes with similar functions are embedded together.


