
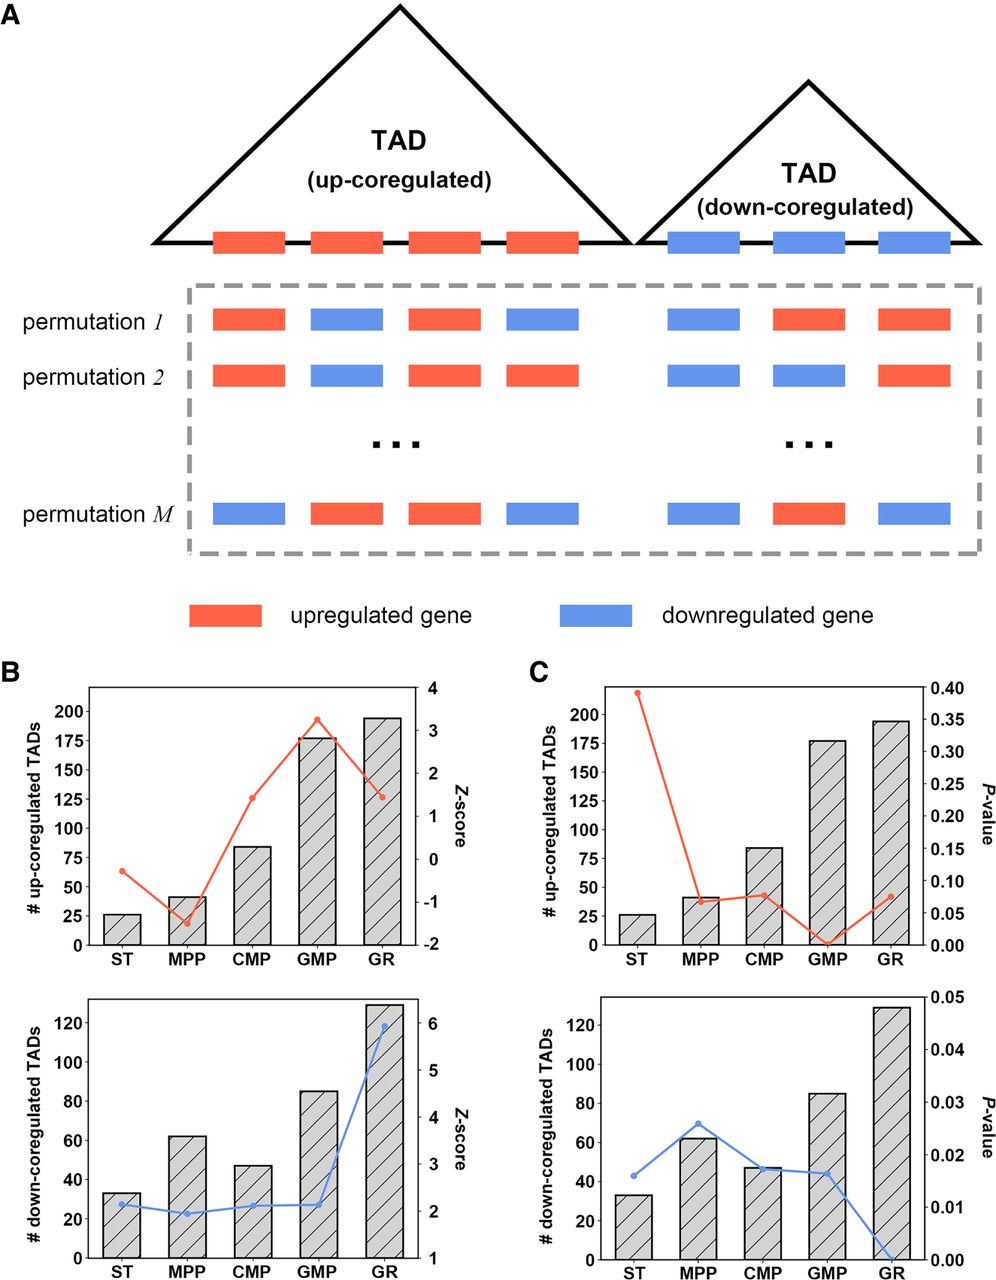
Figure 7.
Contribution of hierarchical TADs in transcriptional coregulation. (A) Schematic of random genome permutation (for details, see Supplemental Methods) and up(down)-coregulated TADs. Barplot of the number of up(down)-coregulated TADs and lineplot of the corresponding Z-scores (B) and P-values (C) for each cell type in GR path.


