
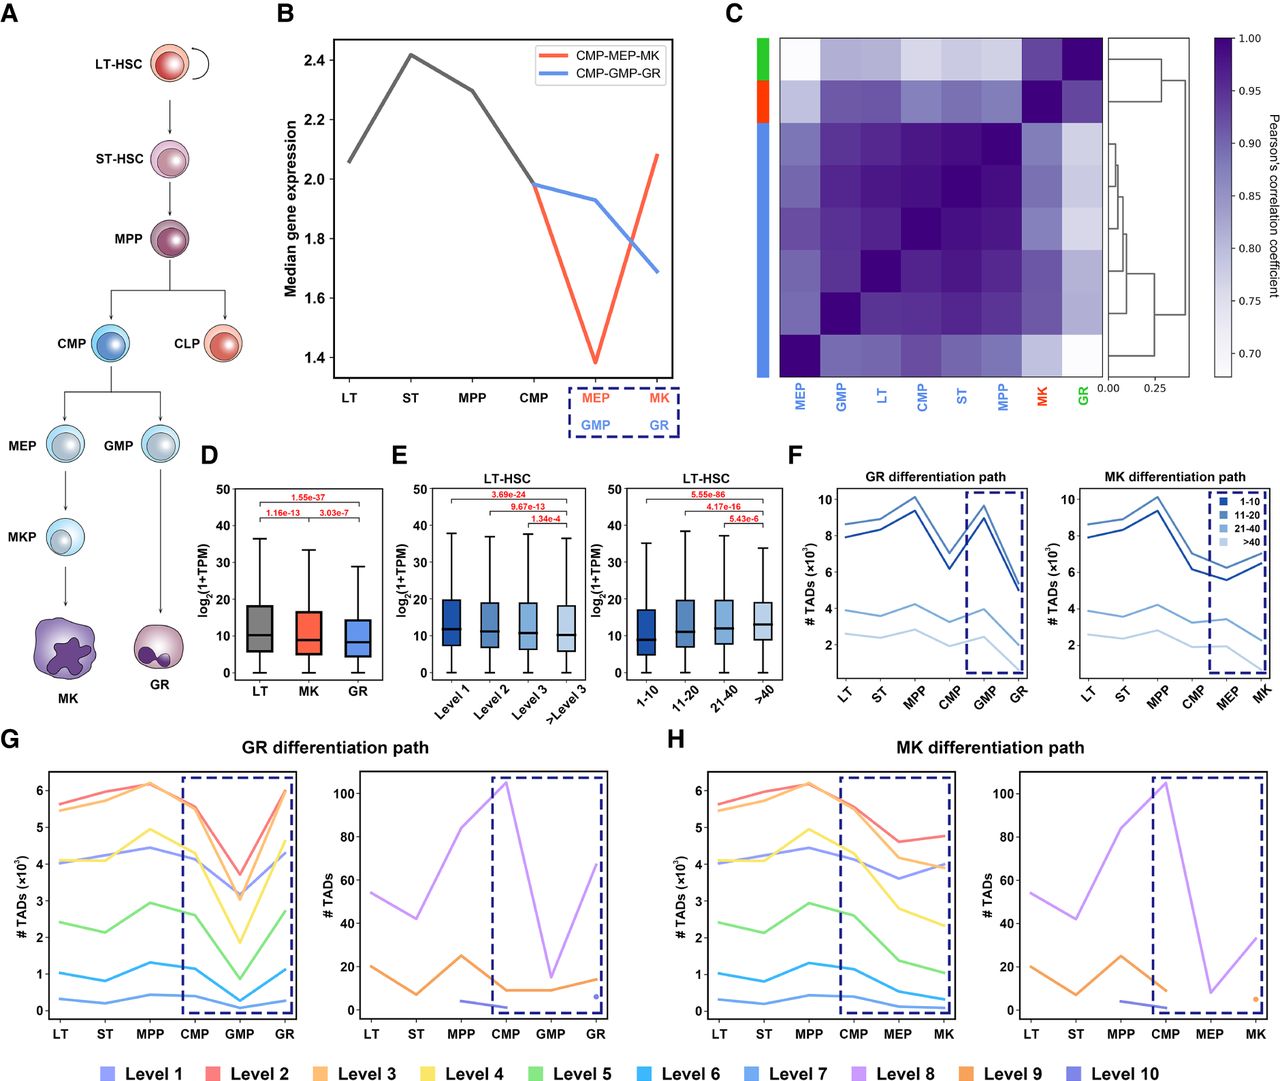
Hierarchical TADs illuminate a brand-new landscape of mouse hematopoiesis. (A) The well-studied differentiation tree of 10 mouse hematopoietic cell types. (B) Median gene expression of each cell type in both GR and MK path. (C) Hierarchical clustering of eight cell types in terms of active gene expression vector of each cell type, in which the three clusters are marked with different colors. The values of the heatmap represent the Pearson's correlation coefficients of active gene expression vector between two cell types. (D) Gene expression in TADs of greater than level 2 identified by BINDER in LT, MK, and GR (P-values, Wilcoxon rank-sum test). (E) Boxplots of gene expression (log2(1 + TPM)) within TADs of different levels and lengths (bin length) of LT-HSC, in which the expression value of a TAD is defined as the average nonzero expression value of all genes within it (P-values, Wilcoxon rank-sum test). (F) Number of TADs of different sizes of six cell types in GR (left) and MK (right) path. Number of TADs of different levels in GR (G) and MK path (H).


