
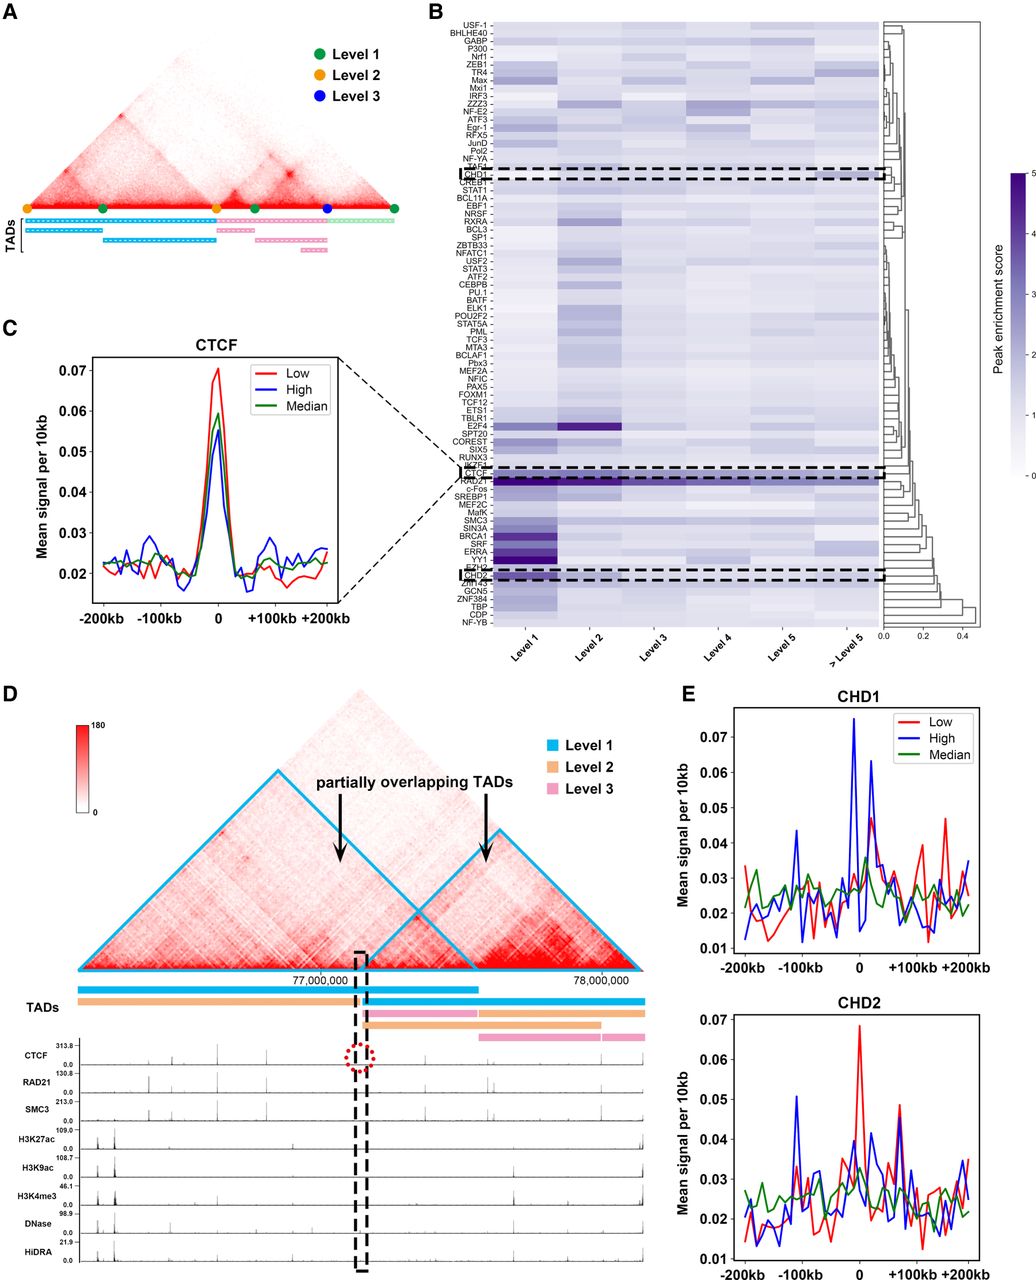
Hierarchical TAD boundaries reveal distinct transcription factor (TF) features. (A) An illustration of hierarchical TAD boundaries. Green, blue, and yellow dots indicate TAD boundaries of levels 1, 2, and 3, respectively. (B) Hierarchical clustering of 77 TFs by their peak enrichment scores near hierarchical TAD boundaries, with darker colors indicating higher scores. (C) Enrichment of CTCF near TAD boundaries is represented by red, green, and blue lines for low, medium, and high levels, respectively: low, level < 4; medium, 3 < level < 6; and high, level > 5. (D) Example of a partially overlapping TAD (Chr 1: 76,130,000–78,150,000, 10 kb GM12878), generated by 3D Genome Browser (Wang et al. 2018b) and UCSC Genome Browser (Nassar et al. 2023). (E) Enrichment of CHD1 and CHD2 near hierarchical TAD boundaries of low, median, and high levels.


