
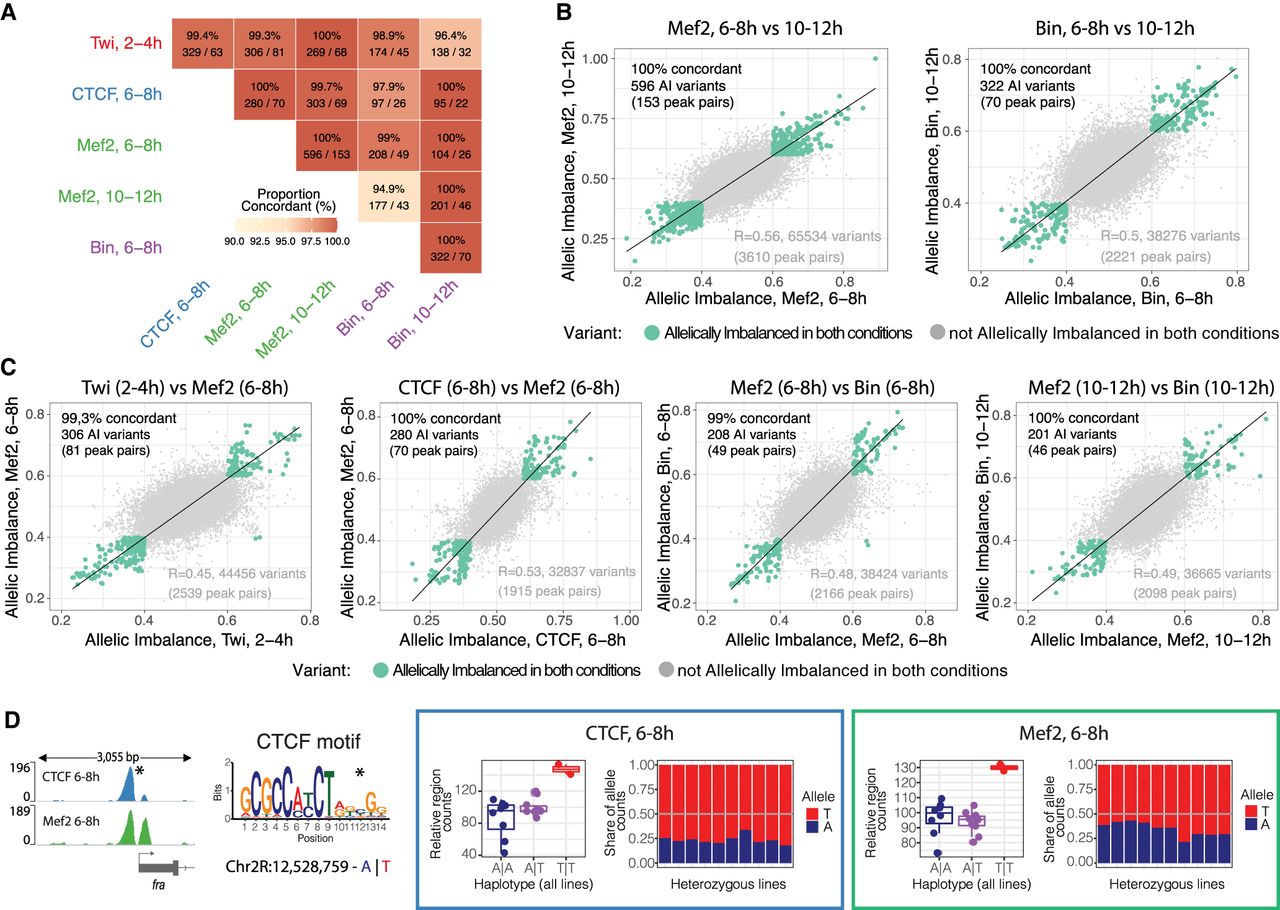
Variants outside the TF's motif might act through disrupted cooperative or collaborative binding. (A) Percentage of concordant (same allelic imbalance direction) variants in coaffected peaks for different conditions. Percentage of concordant direction and number of significant shared variants/number of coaffected peaks are indicated. Only variants with unique allelic imbalance values are considered for each pair of coaffected peaks. (B,C) Correlation in allelic imbalance for variants affecting pairs of conditions: Mef2 at 6–8 versus 10–12 h and Bin at 6–8 versus 10–12 h (B); and Twi at 2–4 h versus Mef2 at 6–8 h, CTCF versus Mef2 at 6–8 h, Mef2 versus Bin at 6–8 h, and Mef2 versus Bin at 10–12 h (C). Each dot represents a variant (all variants, imbalanced and not imbalanced, with unique allelic imbalance values per peaks overlapping between conditions are considered). Green dots indicate allelically imbalanced variants in both conditions; gray dots, nonimbalanced variants (allelically imbalanced in only one or no conditions). The percentage of concordance in allelic imbalance between conditions (same as in A) and the number of variants and coaffected peaks are indicated for allelically imbalanced variants in both conditions (top left). Spearman's correlation for all variants (green and gray dots) and total number of variants and total number of peaks overlapping between conditions (bottom right). (D) Examples of a pair of coaffected peaks for CTCF and Mef2 at 6–8 h, in which one of the TF motifs was disrupted by variants. (Far left) Browser tracks showing coaffected peaks (merged across all genotypes per factor) and affected TF motif (affected position marked with an asterisk; reference and alternative alleles are indicated in blue and red, respectively). (Right) Boxes represent coverage counts for CTCF (blue) and Mef2 (green) split by allele. In each box, the left panel shows the normalized total read counts for the two genotypes for each of the two coaffected peaks; the right panel shows allelic ratios (from CHT) in all heterozygous lines. Replicates are included as independent observations.


