
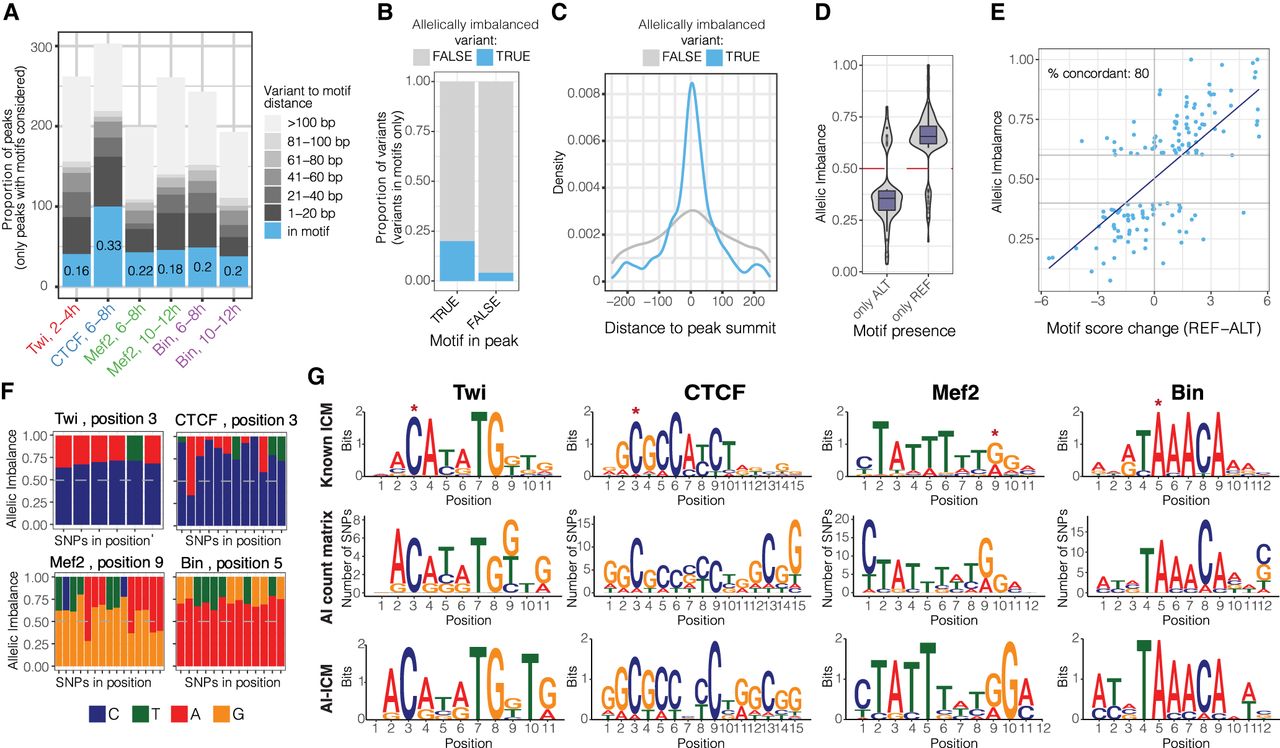
Allele-specific binding provides functionalized TF motif binding preferences at single–base pair resolution. (A) Distribution of allele-imbalanced peaks by the shortest distance of significant variants to TF motif (only imbalanced peaks with motifs considered). The fraction of imbalanced peaks with significant variants disrupting TF motif is indicated for each condition (blue color and numbers). (B) The fraction of significant (blue) and nonsignificant (gray) variants among all variants in motifs located in and outside TF peaks (x-axis). Combined data for all conditions are shown. (C) For significant (blue) and nonsignificant (gray) variants in motifs, distribution of variants’ location relative to peak summit. Only motifs in peaks are considered. Combined data for all conditions are shown. (D) Allelic imbalance (y-axis) of peaks with significant variants in motifs, when the motif is called only in the reference or only in the alternative allele (x-axis). Combined data for all conditions are shown; imbalance >0.5 indicates reference allele bias. (E) Peak allelic imbalance (y-axis) versus motif score change (reference – alternative allele; x-axis) for significant variants inside TF motifs. Only cases in which motif is called in both alleles are considered. Combined data for all conditions are shown; variants with an absolute motif score change below one are not shown. The share of concordant variants (variants for which motif score change agrees with direction of allele imbalance) between AI and score change is indicated. (F) Allele imbalances associated with variants disrupting TF motifs: Twi at position 3, CTCF at position 3, Mef2 at position 9, and Bin at position 5. Each bar represents a single SNP; colors represent two alleles for each SNP; and the y-axis shows allele imbalance. (G, top) Motif logos of analyzed TFs from known information content matrix (ICM). (Middle) Logos represent counts of preferred nucleotides at each position where allelically imbalanced variants occur (allelically imbalanced count matrix). (Bottom) Allelically imbalanced count matrices (middle) were transformed into information content matrices and visualized as standard motif logos (allelically imbalanced − ICM).


