
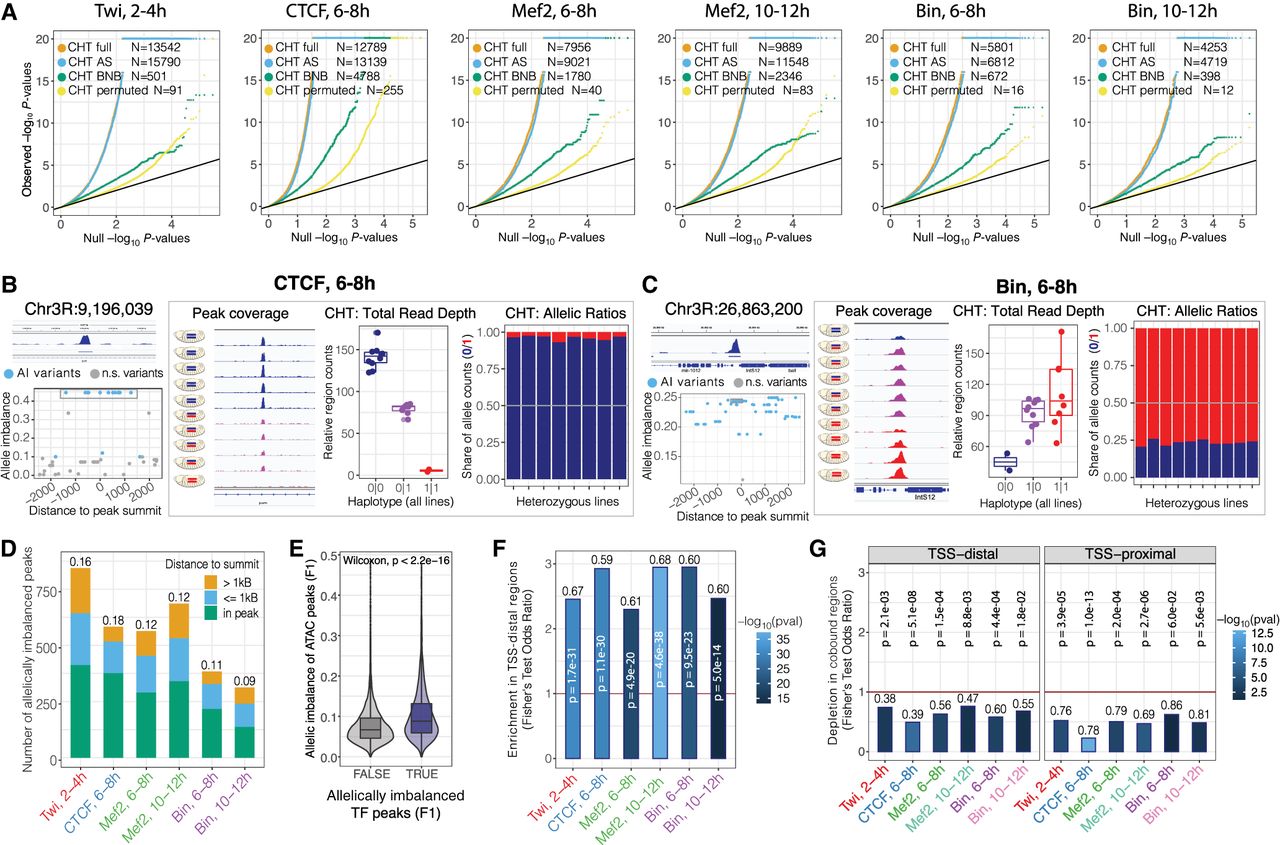
Genetic variation has extensive effects on TF binding during embryogenesis. (A) QQ-plots showing CHT results for Twi at 2–4 h, CTCF at 6–8 h, Mef2 at 6–8 h, Mef2 at 10–12 h, Bin at 6–8 h, and Bin at 10–12 h. For each data set, actual P-values are plotted against uniform P-value distribution for the full CHT (orange), allele-specific (AS) component of the CHT (blue), read depth (BNB) component, and CHT with permuted genotypes (yellow). Number of variants significant at 1% FDR with AI > 0.1 are provided in the inset. (B) Example of CTCF peak at 6–8 h affected by genetic variation based on CHT. (Left, top) Browser track for the corresponding peak (average signal across all lines), coordinates of the peak summit is indicated. (Below) Allelic imbalance (y-axis) for all variants in 2.5 kb radius around peak summit. Significant variants are shown in blue. Top significant variants with the same haplotype (0|1) are highlighted with gray box. For these variants, browser tracks for all lines (middle) and two components of CHT are shown (right). (Middle) Schematic embryos next to browser tracks indicate haplotypes and normalized ChIP signal of the lines. (Right) Components of the CHT: normalized total read counts for the corresponding peak in all lines (total read depth; left) and share of reads mapped to the reference and alternative alleles in heterozygous lines (allele ratios; right). Colors represent genotypes: blue (reference), red (alternative), magenta (heterozygous). (C) Same as A, for an imbalanced peak of Bin at 6–8 h in the IntS12 locus. (D) Number of allelically imbalanced peaks (y-axis) per condition (x-axis), defined as peaks with at least one associated significant variant. Fraction of imbalanced peaks in the total number of peaks with genetic variation are shown on top of the bars. Colors represent location of the top variant (significant variant with the lowest P-value per peak) relative to the peak summit. (E) Average allelic imbalance of ATAC-seq peaks overlapping imbalanced and nonimbalanced ChIP-seq peaks from our data set. Allele imbalances of ATAC-seq peaks were quantified in the same F1 crosses in the work of Floc'hlay et al. (2021). (F) Enrichment of imbalanced peaks in TSS-distal regions (>500 bp from a TSS) per condition (x-axis). Fisher's test odds ratios (imbalanced vs. nonimbalanced peaks) are plotted on y-axis. Numbers over the bars indicate fraction of TSS-distal imbalanced peaks over all imbalanced peaks. Color represents the Fisher's test P-value (−log10); the P-value is also reported on top of each bar. (G) Depletion of allele imbalanced peaks in the regions cobound by at least two TFs from our data set for TSS-distal (left) and TSS-proximal (right) imbalanced peaks. Fisher's test odds ratios (imbalanced vs. nonimbalanced peaks) are plotted on y-axis. Numbers over the bars indicate the fraction of cobound imbalanced peaks from all imbalanced peaks. Color represents the Fisher's test P-value (−log10); the P-value is reported over each bar.


