
Figure 5.
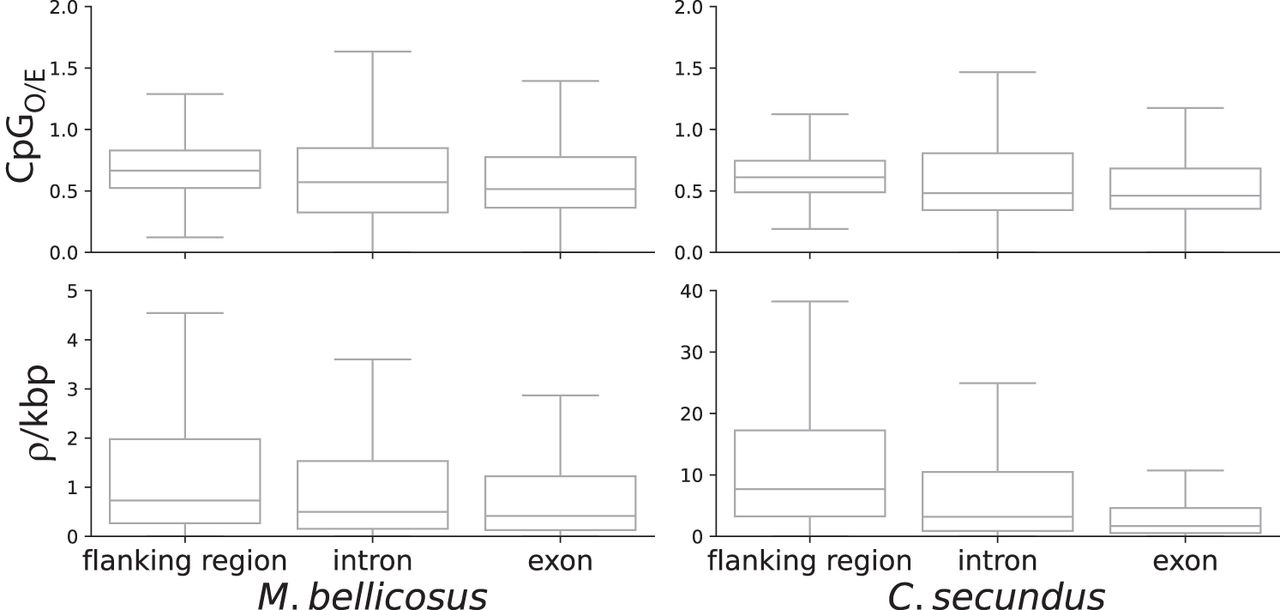
Boxplots showing variation in levels of CpGO/E and recombination rate (ρ/kbp; rho) in genic and flanking regions in the M. bellicosus and C. secundus genomes. The differences between all categories are significant.
(Downloading may take up to 30 seconds. If the slide opens in your browser, select File -> Save As to save it.)
Click on image to view larger version.
Boxplots showing variation in levels of CpGO/E and recombination rate (ρ/kbp; rho) in genic and flanking regions in the M. bellicosus and C. secundus genomes. The differences between all categories are significant.
 CiteULike
 Delicious
 Digg
Digg Facebook
 Google+
 Reddit
 Twitter
