
Figure 2.
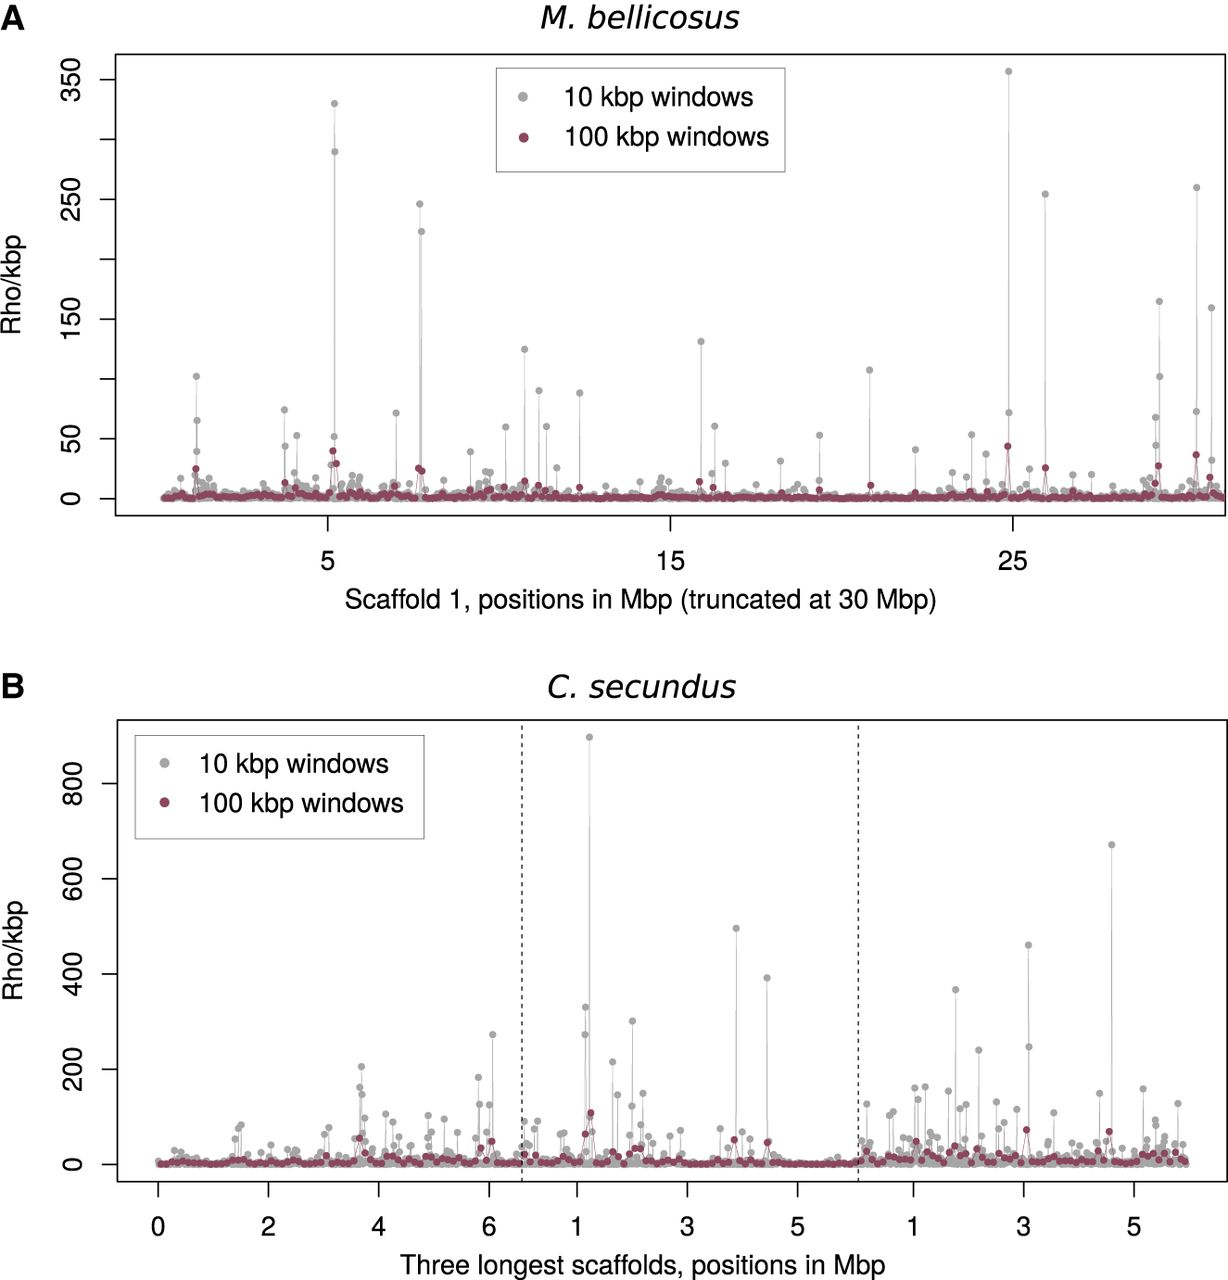
Variation in recombination rates estimated as ρ/kbp across representative genomic scaffolds in M. bellicosus (A) and C. secundus (B). Estimates of ρ/kbp are calculated in 10 kbp and 100 kbp windows.
(Downloading may take up to 30 seconds. If the slide opens in your browser, select File -> Save As to save it.)
Click on image to view larger version.
Variation in recombination rates estimated as ρ/kbp across representative genomic scaffolds in M. bellicosus (A) and C. secundus (B). Estimates of ρ/kbp are calculated in 10 kbp and 100 kbp windows.
 CiteULike
 Delicious
 Digg
Digg Facebook
 Google+
 Reddit
 Twitter
