
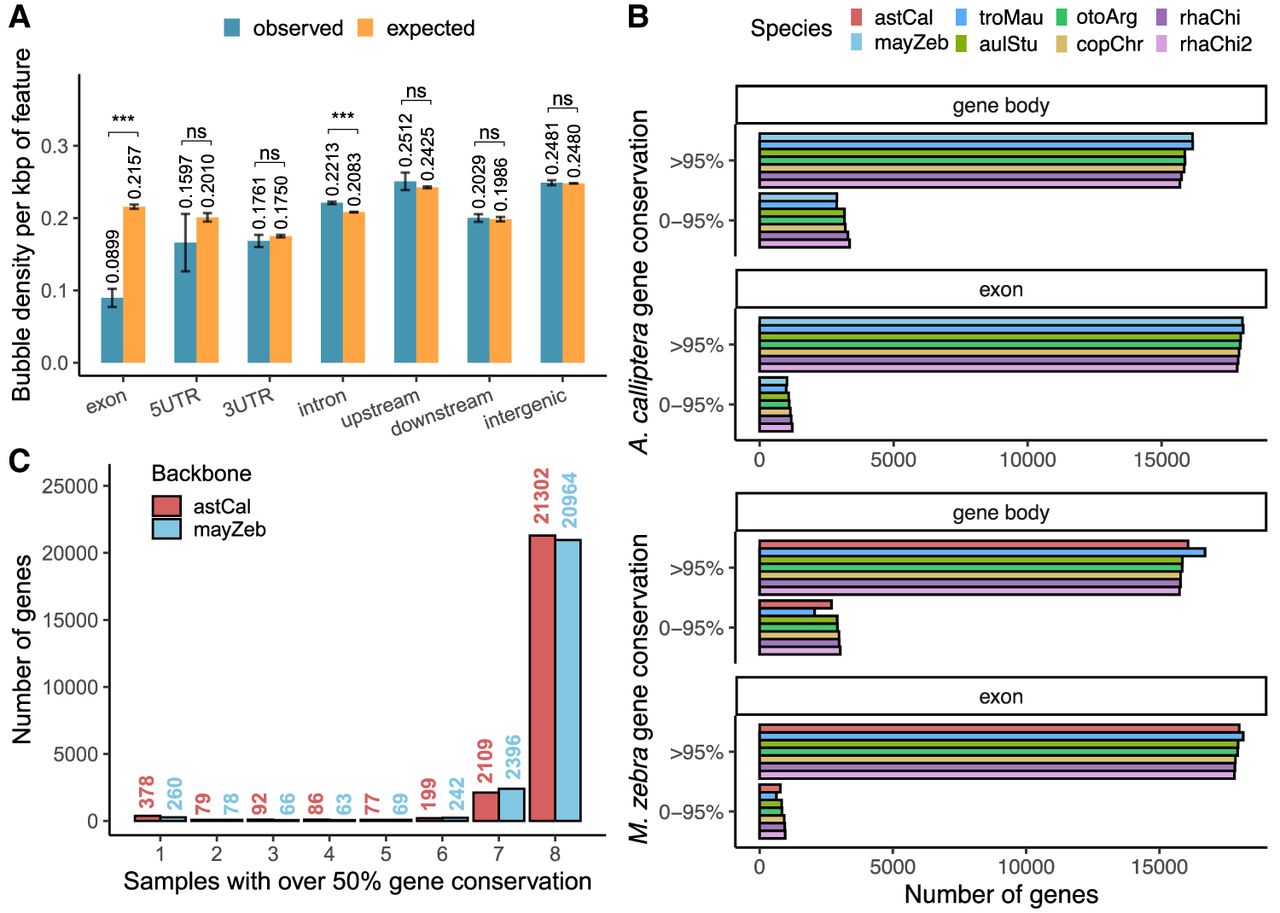
Figure 6.
Genomic context of SVs. (A) Bubble density in gene features; 95% confidence intervals are estimated across 100 bootstraps, for which the SV coordinates were shuffled within ±1000 bp of their original positions (observed) or randomly across the whole genome (expected). (***) P-value < 1 × 10⁻³, (n.s.) not significant. (B) Percentage sequence conservation of genes calculated for backbones with gene annotations. (C) Presence–absence counts of backbone genes. A value of one denotes genes that are not detectable in the other assemblies and might be private, and a value of eight refers to ubiquitous genes.


