
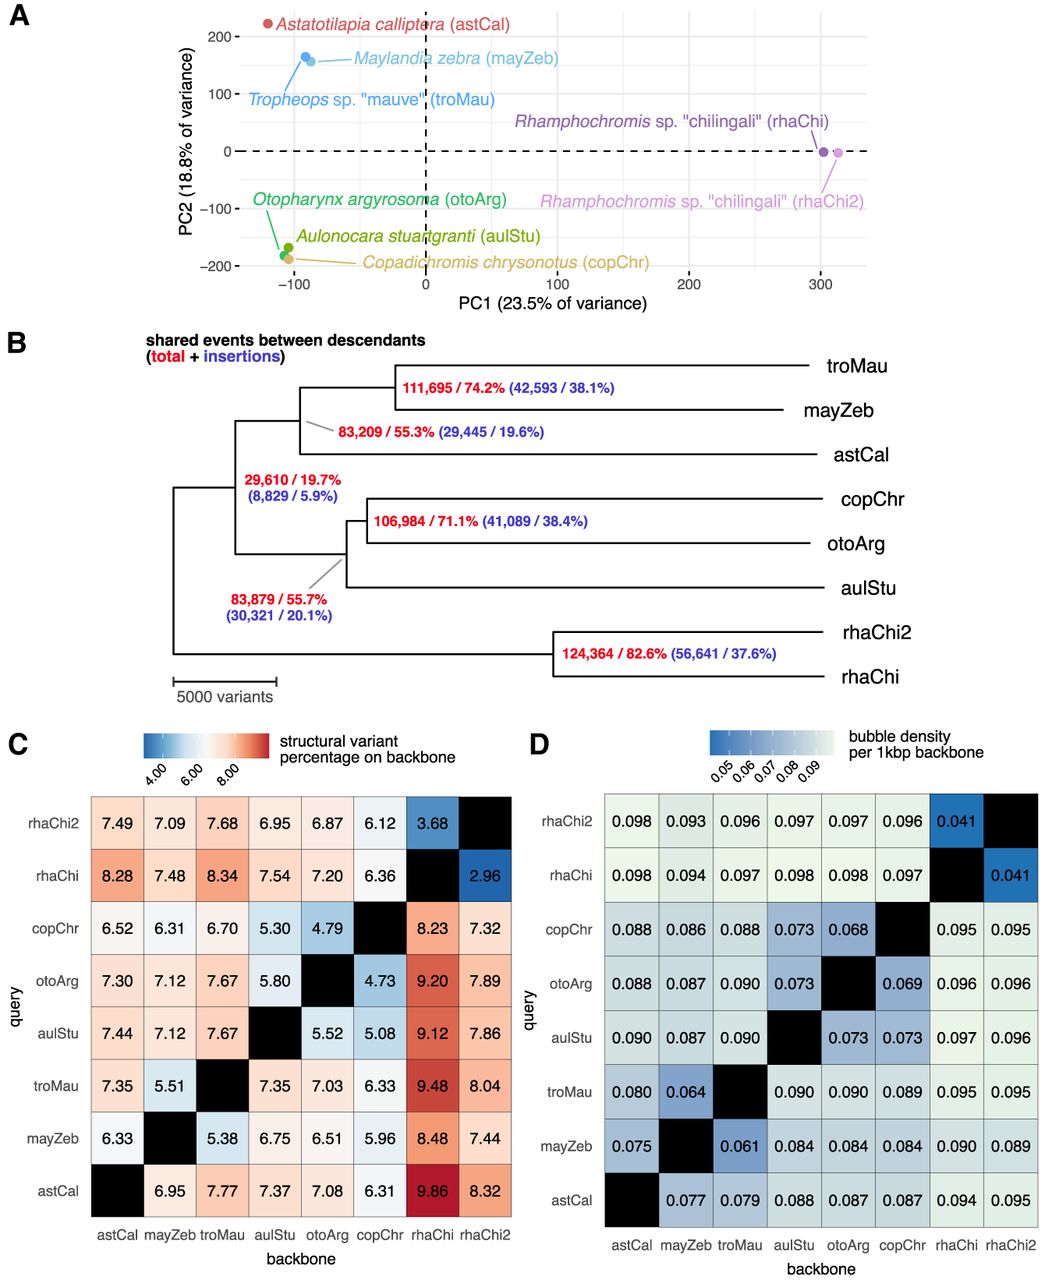
Estimation of phylogenetic relationships between Lake Malawi cichlid assemblies. (A) Principal component analysis of the samples based on a presence/absence matrix across 150,532 bubbles with at most three alleles. (B) Midpoint-rooted neighbor joining tree of Malawi samples estimated from SV events. The distance between any two samples corresponds to the total horizontal branch length separating them. Nodes are labeled with the number of sites at which descendant samples share the same allele (first number) and inserted sequences relative to the shortest allele observed across all samples (second number). (C,D) Structural variation manifested between biassembly graphs between sample pairs as a percentage or bubble density. Comparisons are asymmetrical, in which one assembly acts as a backbone against which the other query is aligned. Minimum variant size in minigraph was set to 50.


