
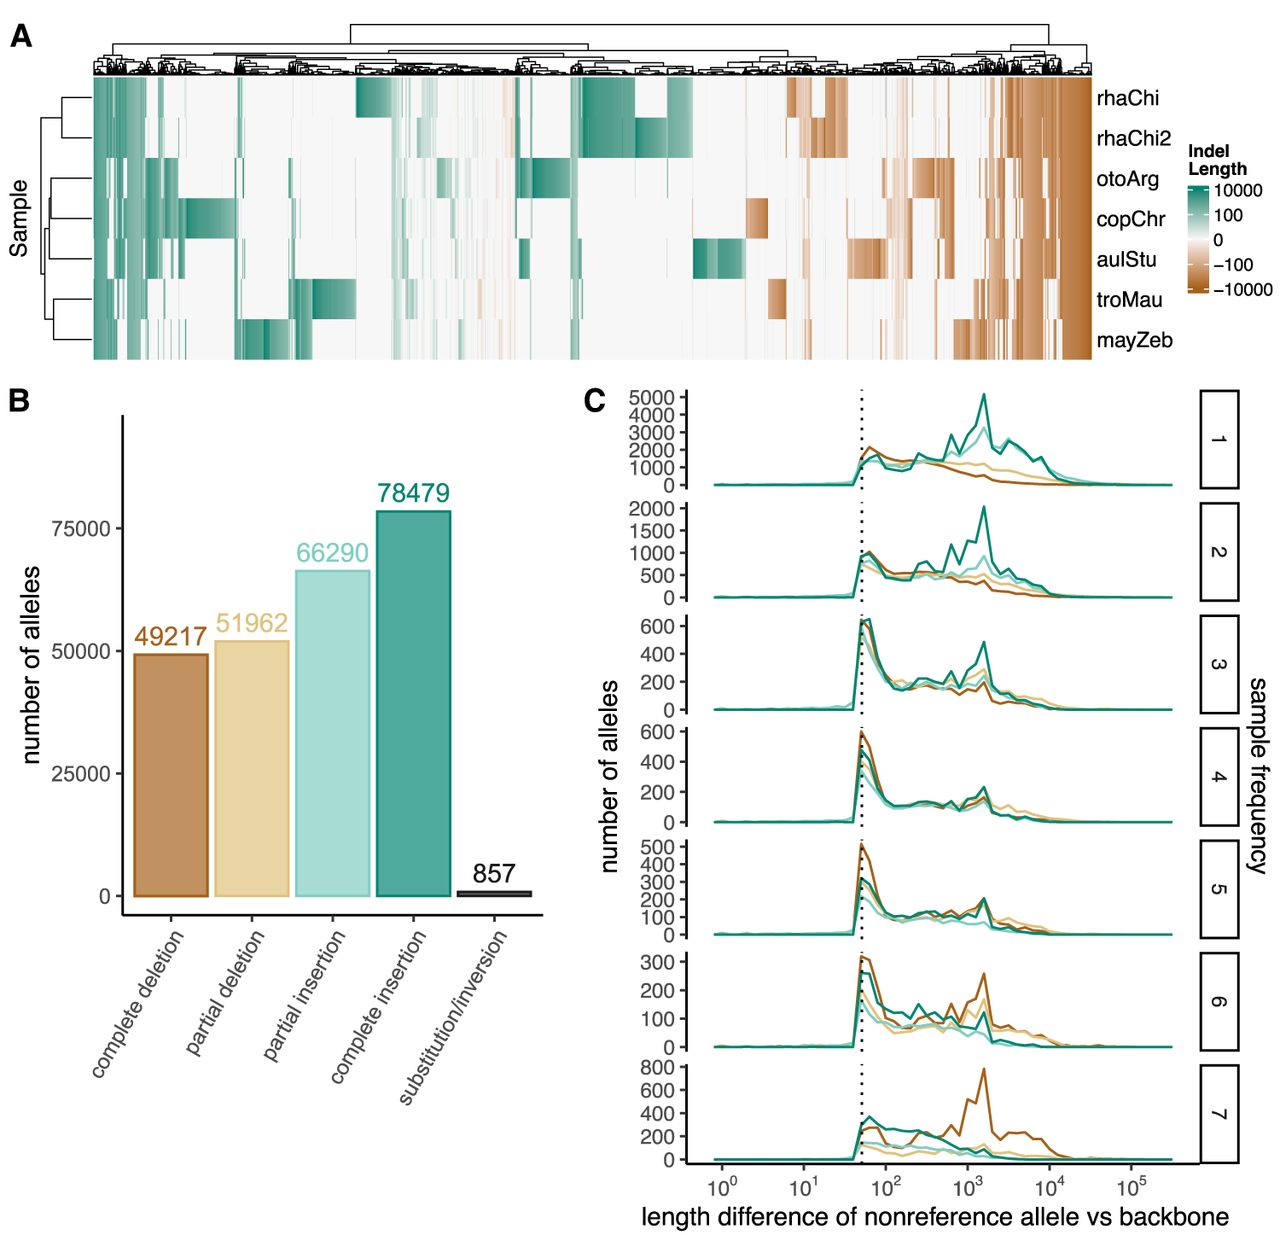
Figure 3.
The Lake Malawi cichlid SV landscape. (A) Heatmap showing length difference of alleles for each nonreference sample versus the A. calliptera backbone across 5000 random bubbles, shown as columns. A positive value (green) represents an insertion, and a negative value (brown) represents a deletion, with darker colors indicating larger SVs/indels. (B) Number of SV alleles by type. (C) Length deviations of nonreference alleles across different sample frequencies. Dashed line denotes 50 bp.


