
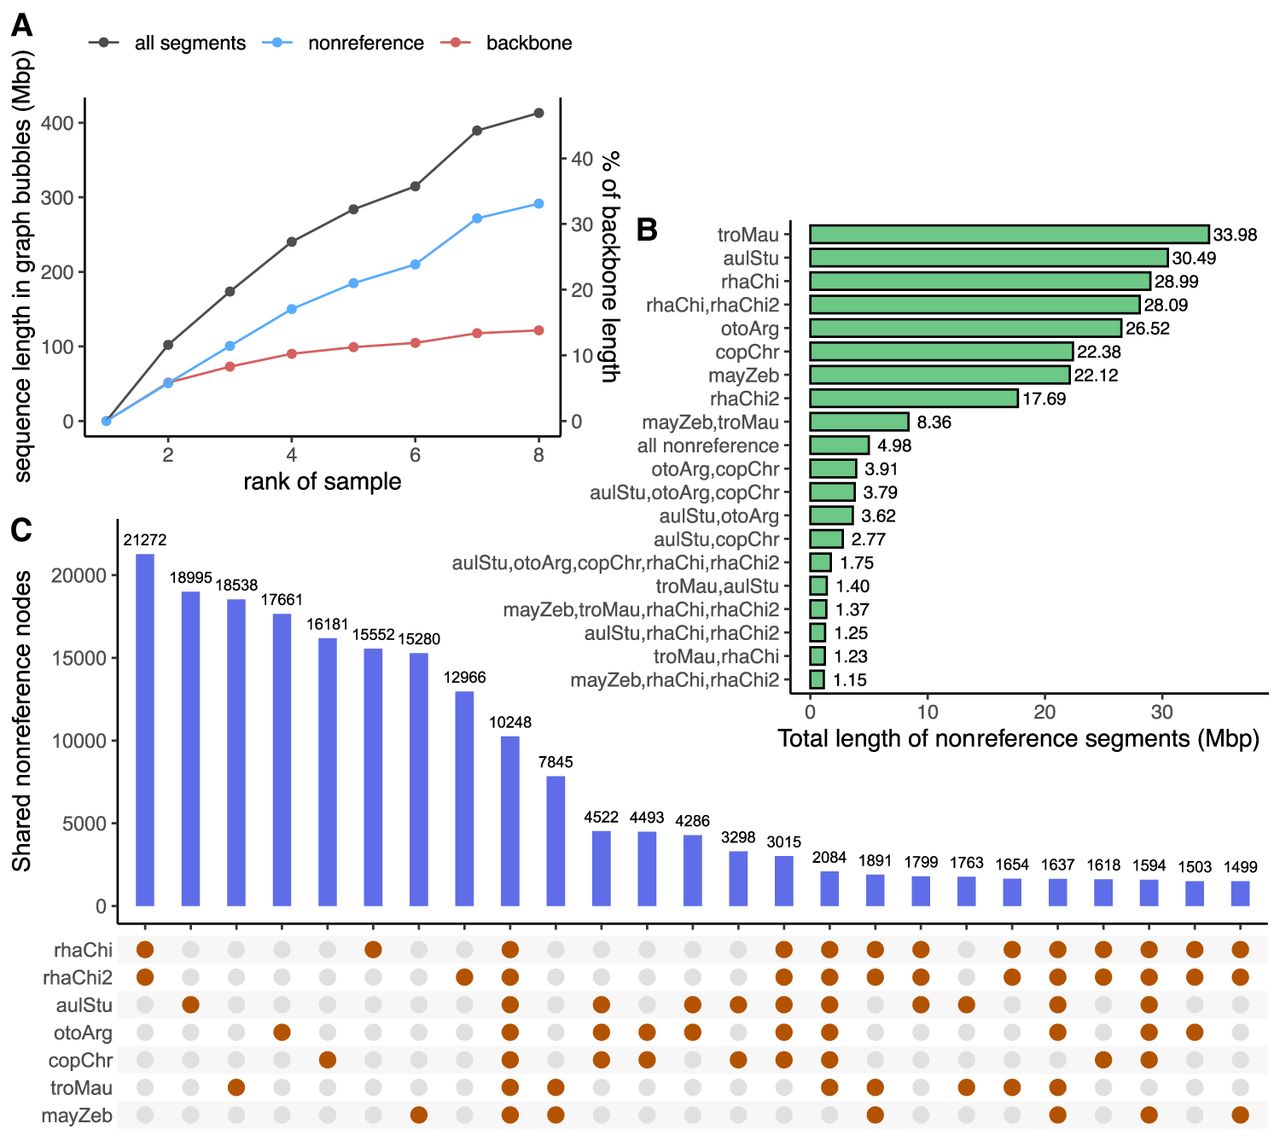
Figure 2.
Nonreference sequences in Lake Malawi pangenome graph. (A) Length of SV sequences in the graph bubbles, based on whether they originated from nonreference assemblies (blue) or the backbone (red). (B,C) Cumulative length and number of graph segments shared across assemblies.


