
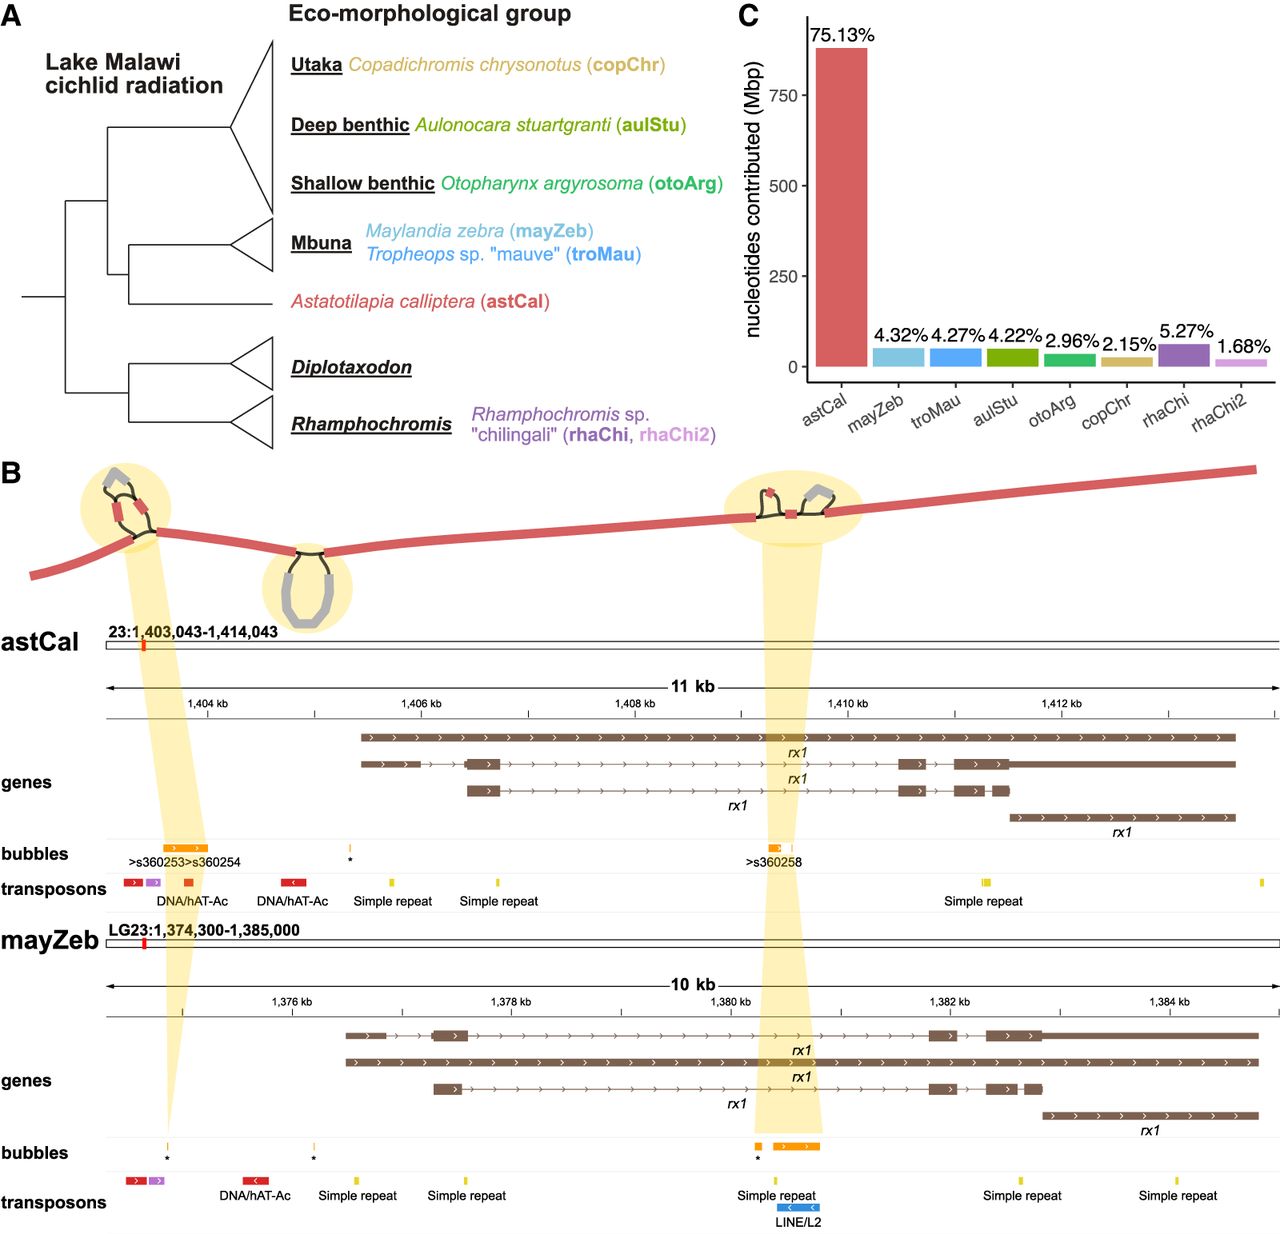
Features of the Lake Malawi haplochromine cichlid assemblies and pangenome graph. (A) Phylogenetic tree of cichlid species used in this study, shown as part of their ecomorphological groups. (B) Visualization of the pangenome graph around the retinal homeobox 1 (rx1) gene involved in cichlid opsin expression. Structural variants (SVs) are represented as bubbles along the Astatotilapia calliptera fAstCal1.2 backbone, whose segments are colored red. These bubbles are juxtaposed with their corresponding locations on the A. callitpera and Maylandia zebra linear reference genomes, on which gene and transposon annotations are provided. (C) Percentage of sequence in the pangenome contributed from each assembly.


