
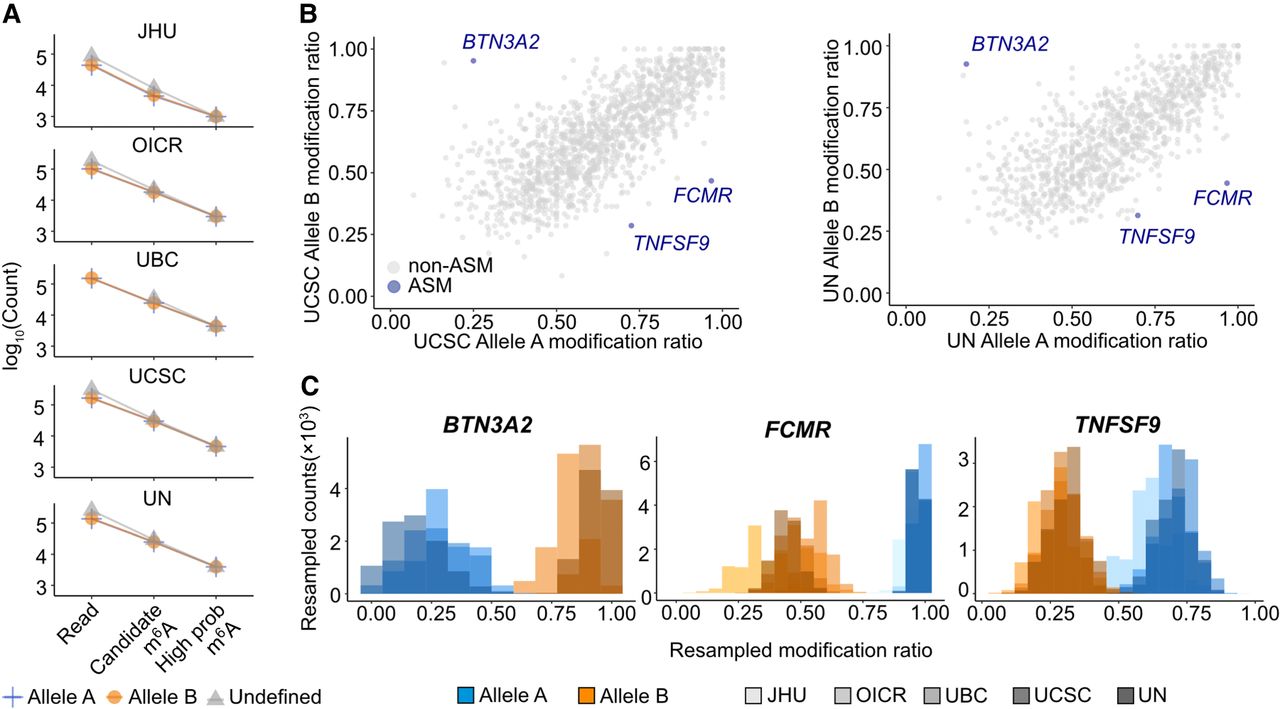
Reproducibility of ASM profiling procedure in human cells. (A) Number of detected candidate m6A modification sites among five replicates (blue, Allele A; orange, Allele B; gray, undefined read classification). (B) Modification ratios from each allele, including three ASM sites (blue) and non-ASM sites (gray) in UCSC (left) and UN (right) data sets, the highest depth data sets among five replicates. The x-axis represents the modification ratio of Allele A reads, while the y-axis represents the modification ratio of Allele B reads. (C) Resampled modification ratios from bootstrapping. Each color represents an allele (blue for Allele A, orange for Allele B), and the gray gradient indicates each replicate.


