
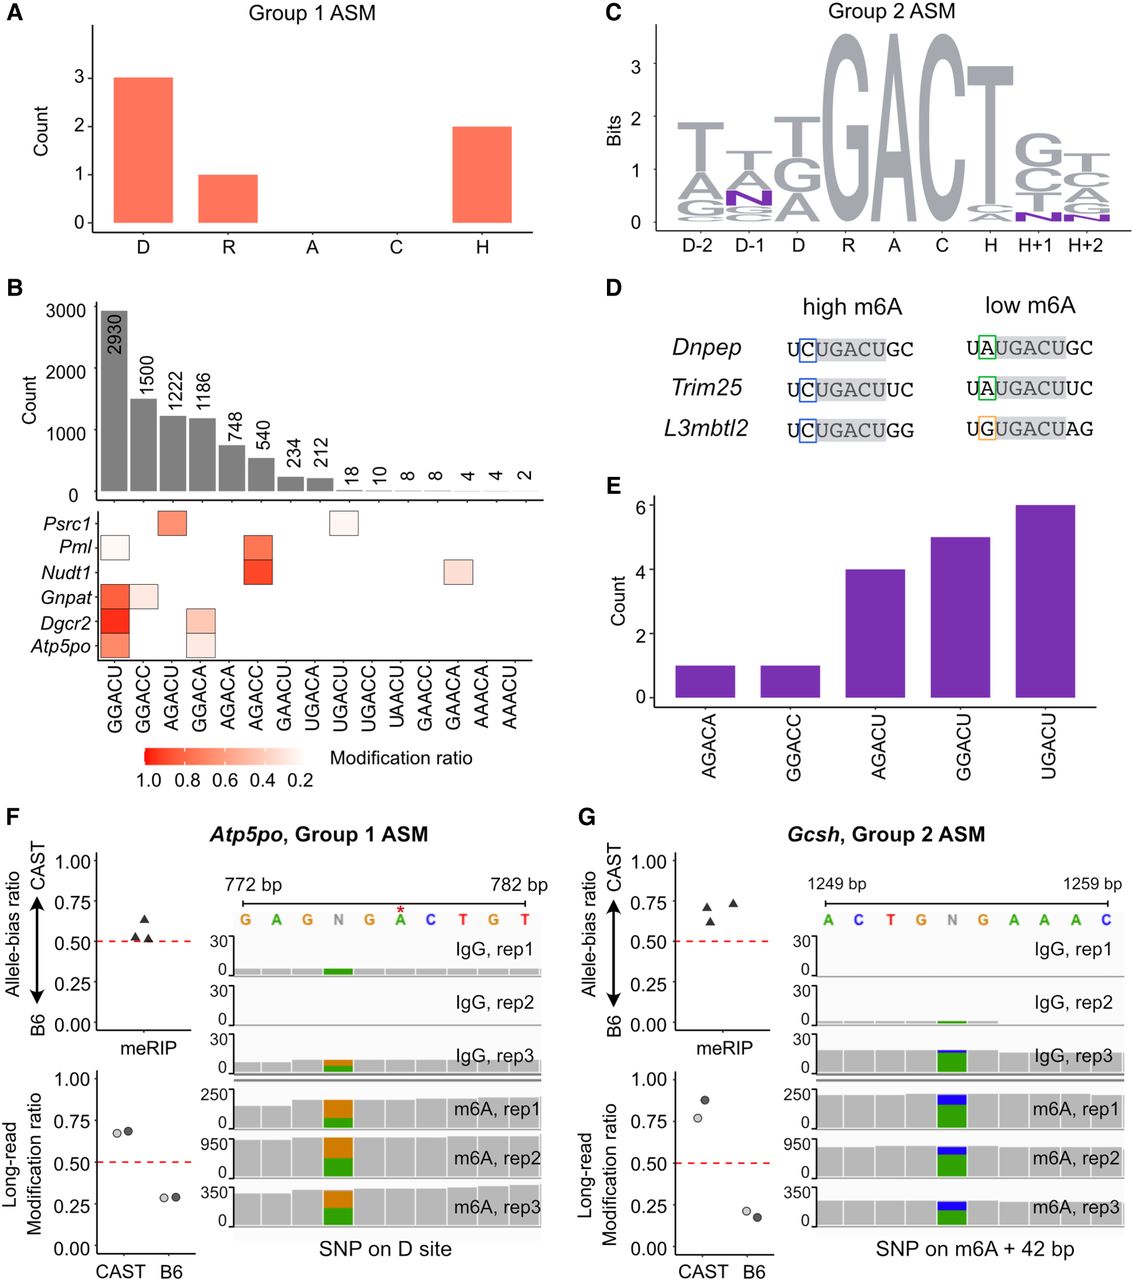
Characterization of ASM sites and orthogonal detection with MeRIP-seq. (A) SNP distribution in Group 1 ASM. (B) Motif frequencies and modification ratios of motif sequences. The top bar plot illustrates motif sequence frequencies in all m6A instances, while the bottom heatmap indicates modification ratios. The first row presents the modification ratio of all instances and the following six rows represent the modification ratio on each motif sequence differentiated by SNPs from two alleles of Group 1 ASM sites. (C) Information content of the extended DRACH motif in 17 Group 2 ASM sites shown in DNA sequence. The D − 1 site has three SNPs, while the H + 1 and H − 2 sites each have one SNP. (D) Extended motif sequences where the D − 1 site possesses SNPs. The gray box represents the DRACH motif, in which all three genes share the same sequence (UGACU) followed by U on the D − 2 site. (E) Motif prevalence in Group 2 ASM. The UGACU motifs are predominantly observed, contrasting with the common m6A motifs, which are typically represented by GGACU. (F,G) Orthogonal detection of ASM through MeRIP-seq and long-read sequencing. On the top panel, points illustrate the allele-bias m6A ratio (proportion of reads from CAST allele) derived from three replicates of MeRIP-seq analysis. The Integrative Genomics Viewer browser displays MeRIP-seq reads on SNPs adjacent to m6A sites, which correspond to the MeRIP-seq allele-bias ratio. The points in the bottom panel indicate the modification ratio of each allele from long-read sequencing, with gray color pairs representing data from two replicates. Two examples from Atp5po, Group 1 ASM (F), and Gcsh, Group 2 ASM (G) are shown.


