
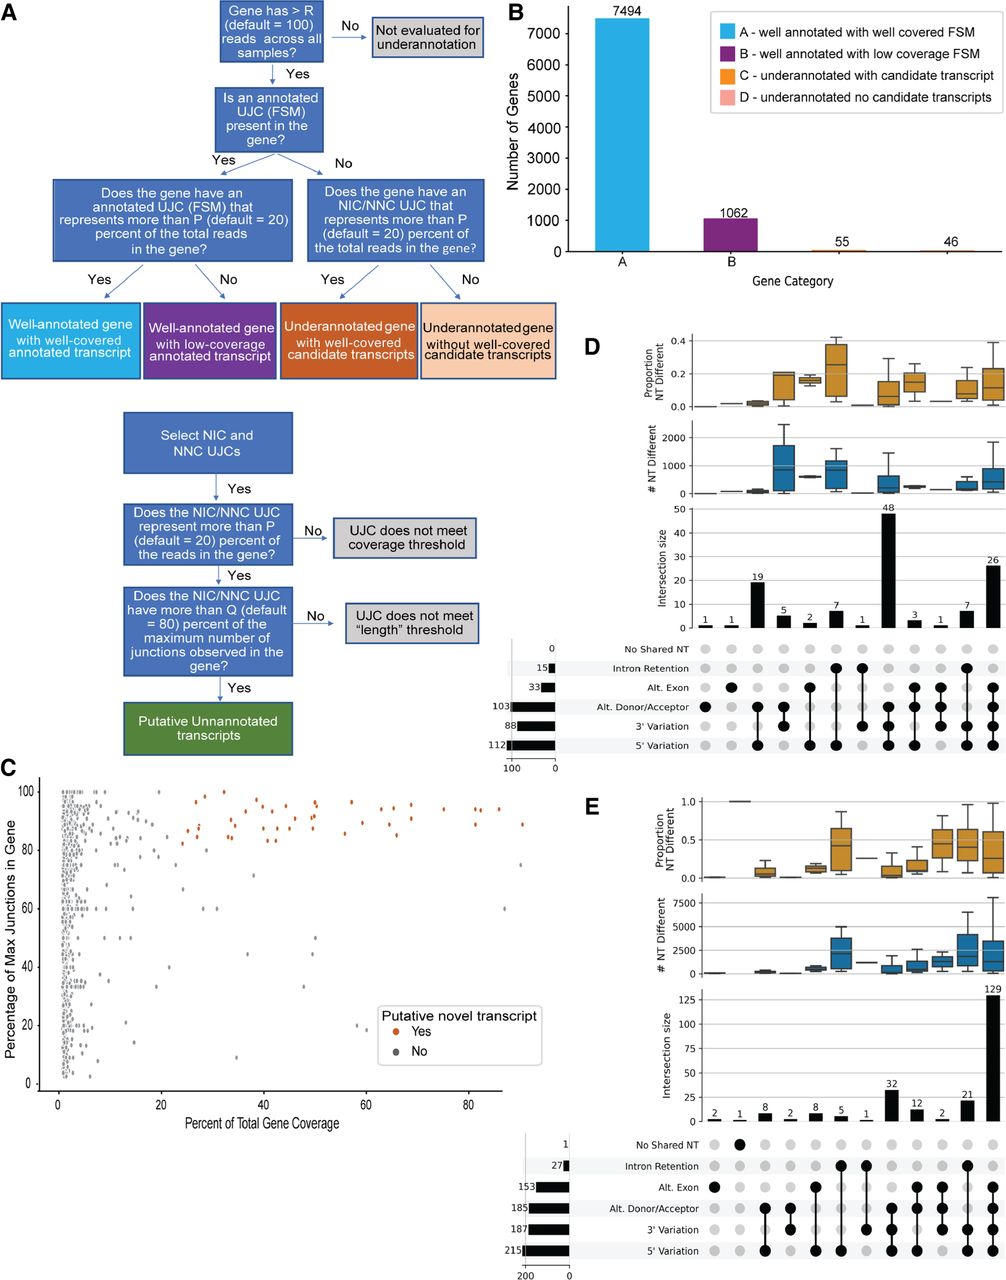
Evaluation of WTC11 PacBio samples for under-annotated genes. (A) Decision tree for classifying genes as well-annotated or under-annotated and classifying transcripts as putative novel transcripts. (B) Number of genes by their annotation status according to SQANTI-reads parameters. (C) The coverage (percent of total reads) versus length (percentage of maximum junctions) for all UJCs in under-annotated genes with well-covered candidate transcripts. UJCs that meet the thresholds for putative novel transcripts are colored in orange. (D,E) UpSet plot of putative novel transcripts with the most expressed annotated transcript in that gene for well-annotated genes with well-covered FSMs (D) and with an FSM detected but without <20% of the total reads in the gene (E). Upper and middle panels show the distribution of the number and proportion of nucleotides different between the putative novel transcript and most expressed FSM.


