
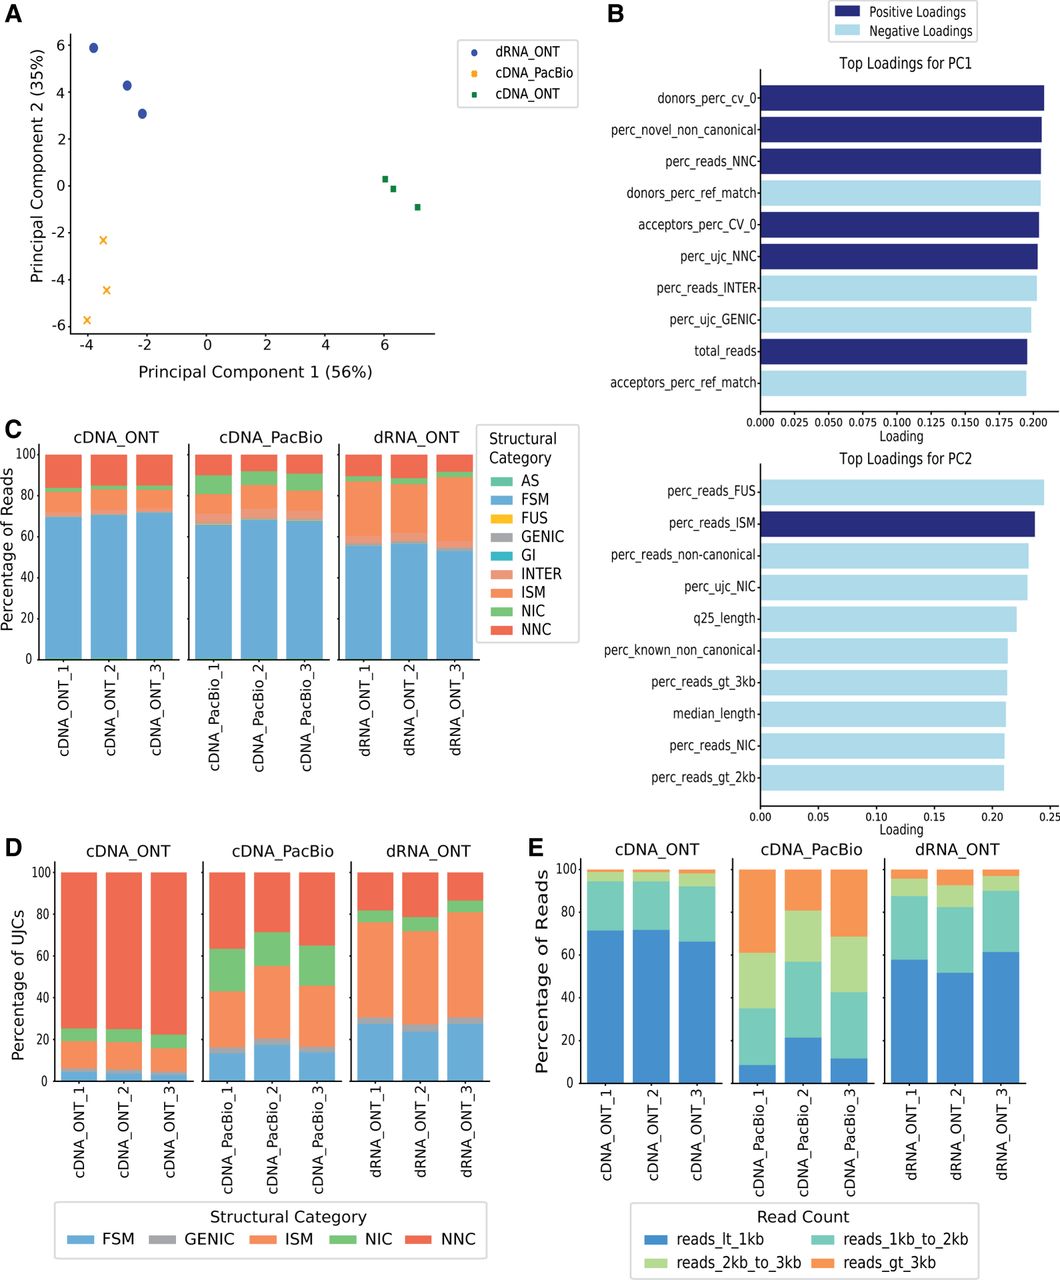
Figure 2.
SQANTI-reads PCA analysis of LRGASP WTC11 samples. (A) PCA using SQANTI-reads quality features. The percentage of variance explained by each principal component (PC) is labeled on each axis in brackets. (B) Top 10 Loadings for PC1 and PC2. (C) Distribution of reads in SQANTI3 structural categories. (D) Distribution of UJCs in structural categories. (E) Distribution of read lengths for all mapped reads.


