
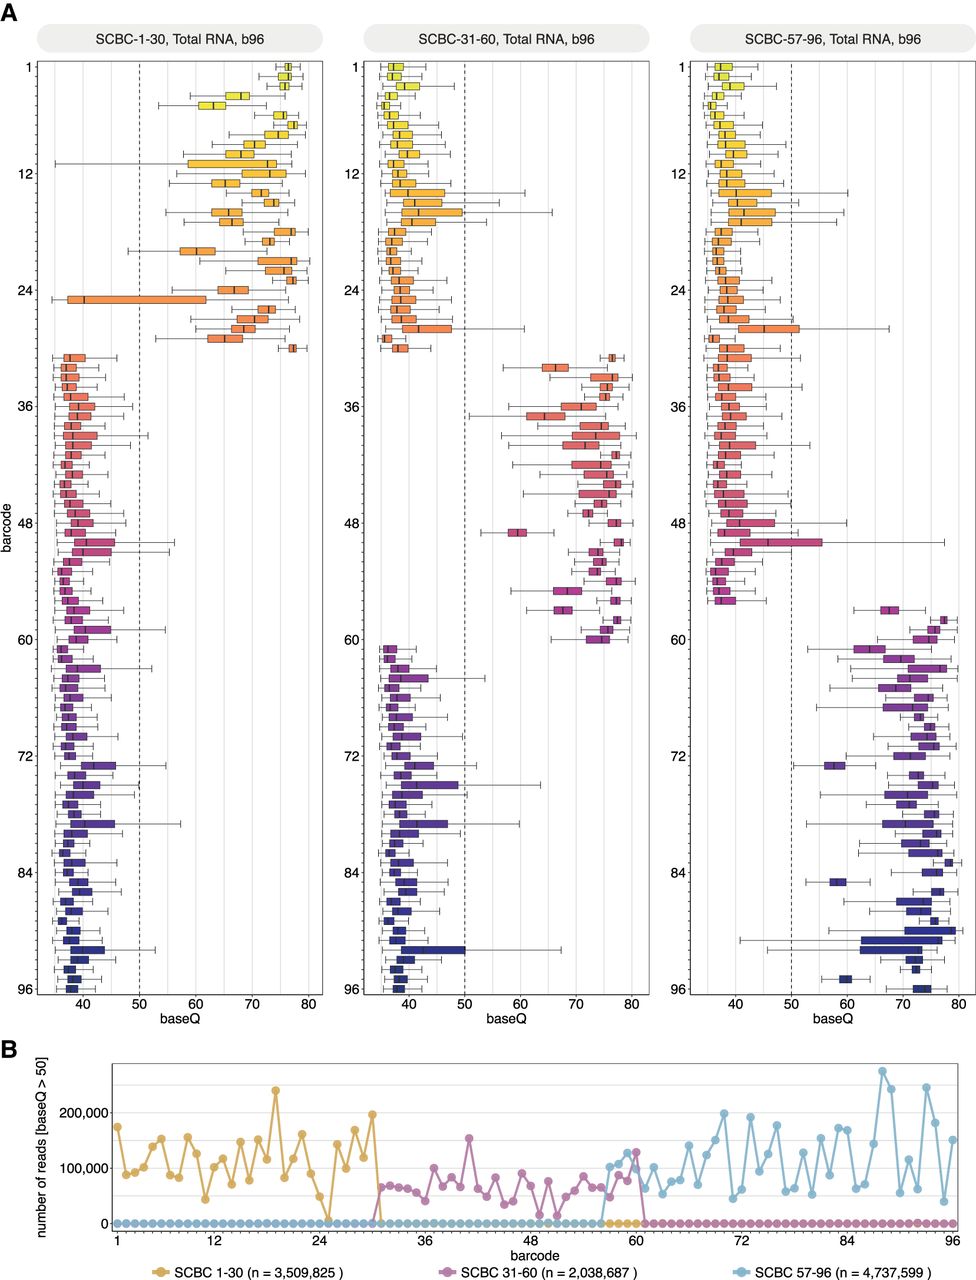
Figure 4.
Performance of SeqTagger's 96 barcode model on independent test data. (A) Boxplots depicting the base quality (baseQ) per barcode for three independent test runs using SCBC1-30 (left panel), SCBC-31-60 (middle panel), and SCBC-57-96 (right panel). Libraries were prepared using poly(A)-tailed total RNA from human samples (see Methods). Boxes are limited by the lower quartile Q1 (bottom) and upper quartile Q3 (top). Whiskers are defined as 1.5 × interquartile range (IQR) with outliers not shown. (B) Lineplot representing the total number of reads for each barcode (baseQ > 50) for runs shown in A, following demultiplexing. The total number of reads for each run with baseQ > 50 is indicated by n.


