
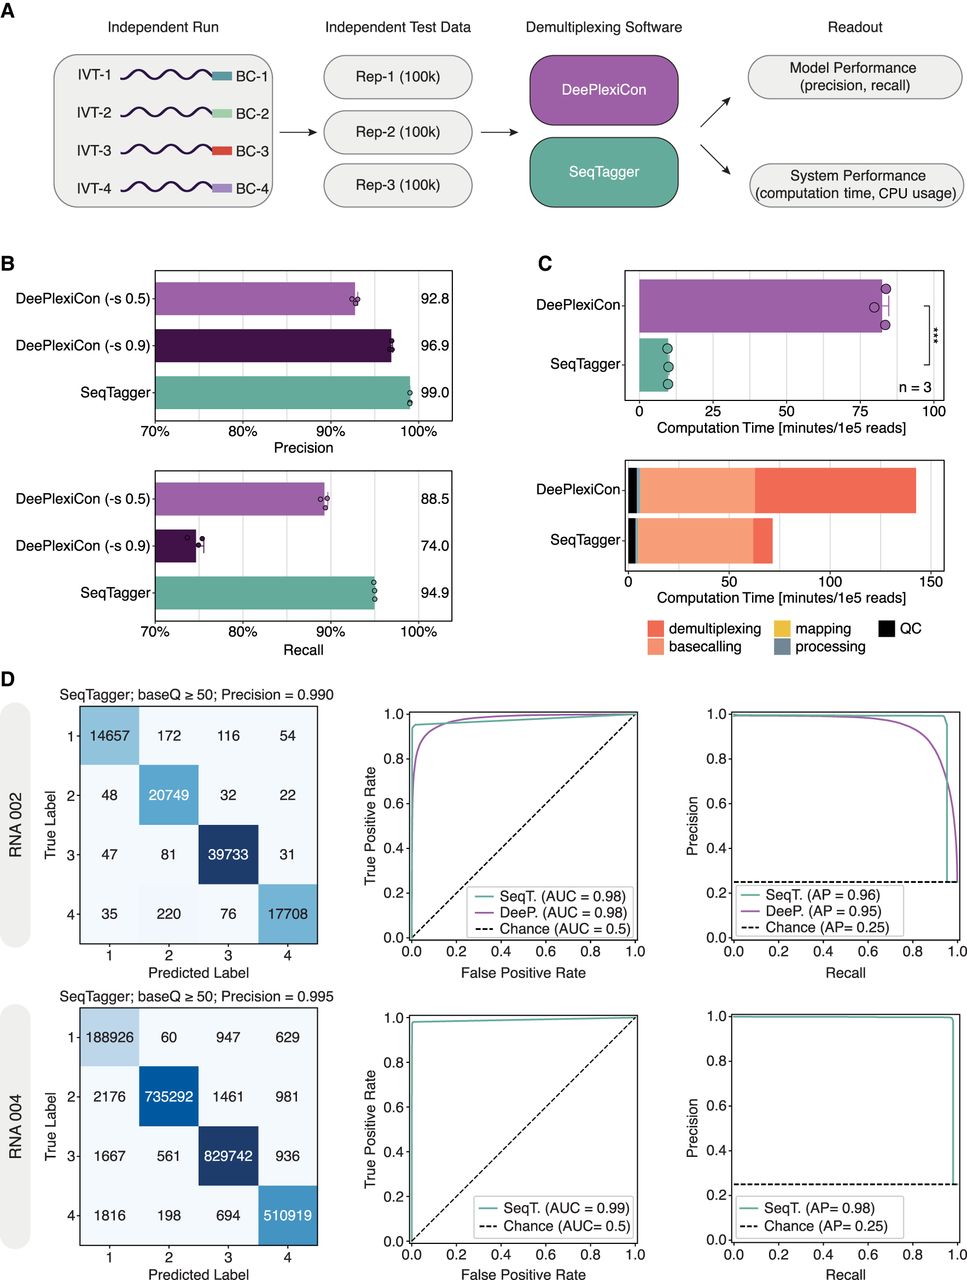
Comprehensive benchmarking of SeqTagger performance. (A) Schematic overview of the workflow used for comparative analysis of DRS demultiplexing software: DeePlexiCon (purple) and SeqTagger (green). (B) Barplots depicting the demultiplexing precision and recall achieved with SeqTagger default settings (baseQ > 50), DeePlexiCon high-recovery settings (-s 0.5), and DeePlexiCon high accuracy settings (-s 0.9), on the same three data sets described in A. Bars represent the mean (also indicated by the numeric value to the right of each bar) with error bars showing ±1 standard deviation. Dots represent individual replicates. (C, top) Barplot depicting the computation time of SeqTagger and DeePlexiCon, on the benchmarking data sets. Bars represent the mean value with error bars indicating ±1 standard deviation. Dots represent individual replicates. Statistical significance was determined using a two-sided t-test (ns): P > 0.05, (*) P ≤ 0.05, (**) P ≤ 0.01, (***) P ≤ 0.001. (Bottom) Barplot representing the absolute contribution of individual preprocessing steps to the total computation time (Rep-1). (D) Confusion matrices (left), receiver operating characteristic (ROC) curves (middle), and Precision–Recall curves (right) on independent test data generated with RNA002 and RNA004 kit chemistries. Data were analyzed with SeqTagger model b04_RNA002 (upper panels) and b04_RNA004 (bottom panels), respectively. (AUC) Area under the curve, (AP) average precision.


