
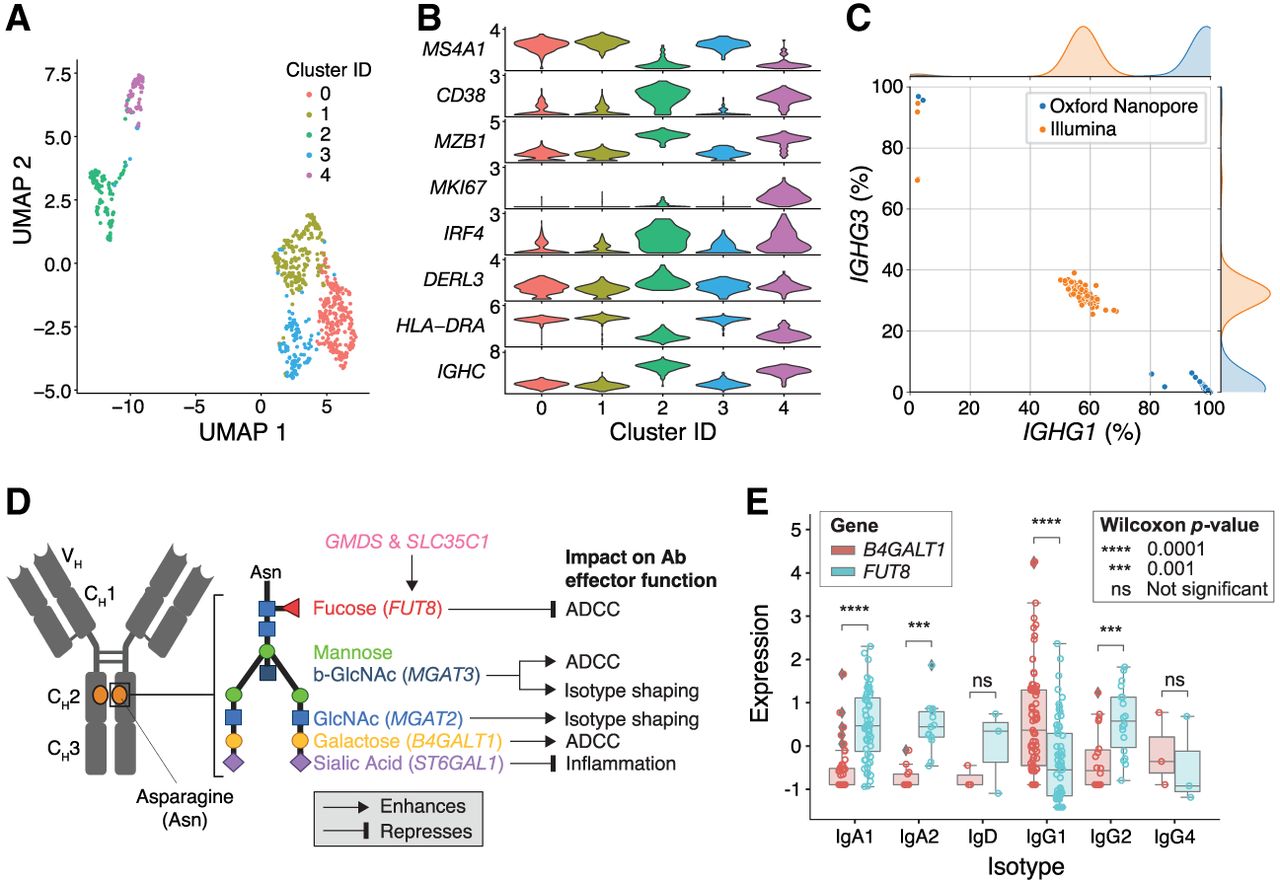
Figure 4.
Single-cell expression data from ASC gate. (A) UMAP visualization of cells clustered by gene expression quantified by nanopore sequencing. (B) Expression of marker genes differentiating in each cluster. (C) Proportion of reads assigned to IGHG1 and IGHG3 within each cell from the ASC gate in both the short-read and nanopore sequencing data sets. (D) Schematic illustrating the genes involved in glycosylation of the conserved asparagine residue in the CH2 domain of the heavy chain. (E) Differential expression of two genes in the glycosylation pathway, B4GALT1 and FUT8, in certain antibody isotypes of plasmablasts and plasma cells from the ASC gate. Each point represents a single cell.


