
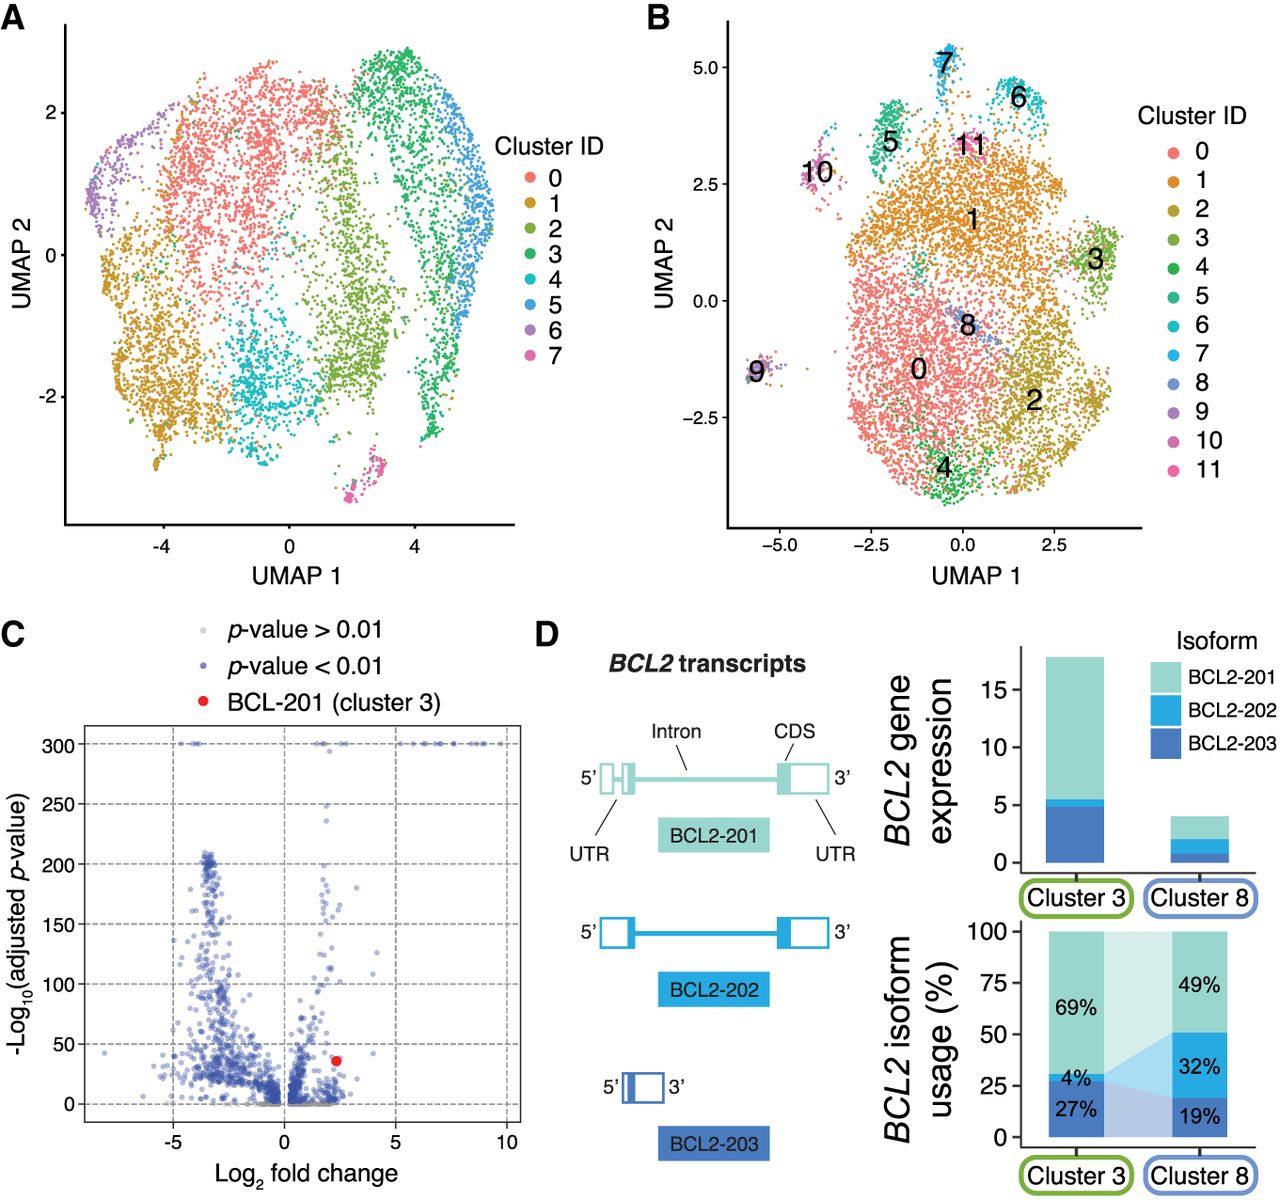
Single-cell expression data from the MBC gate. (A) Uniform Manifold Approximation and Projection (UMAP) visualization of cells clustered by gene expression quantified by short-read sequencing. (B) UMAP visualization of cells clustered by isoform expression quantified by nanopore sequencing. (C) Volcano plot showing isoforms that are differentially expressed in one cluster relative to the entire population of cells, with Bonferroni-adjusted P-values. One differentially expressed isoform of the apoptosis regulating gene BCL2 is highlighted. (D) Cluster-specific expression of the BCL2 gene and the differential transcript usage of three BCL2 isoforms. BCL2–202 isoforms make up only 4% of BCL2 transcripts in cluster 3 but represent 32% of BCL2 transcripts in cluster 8.


