
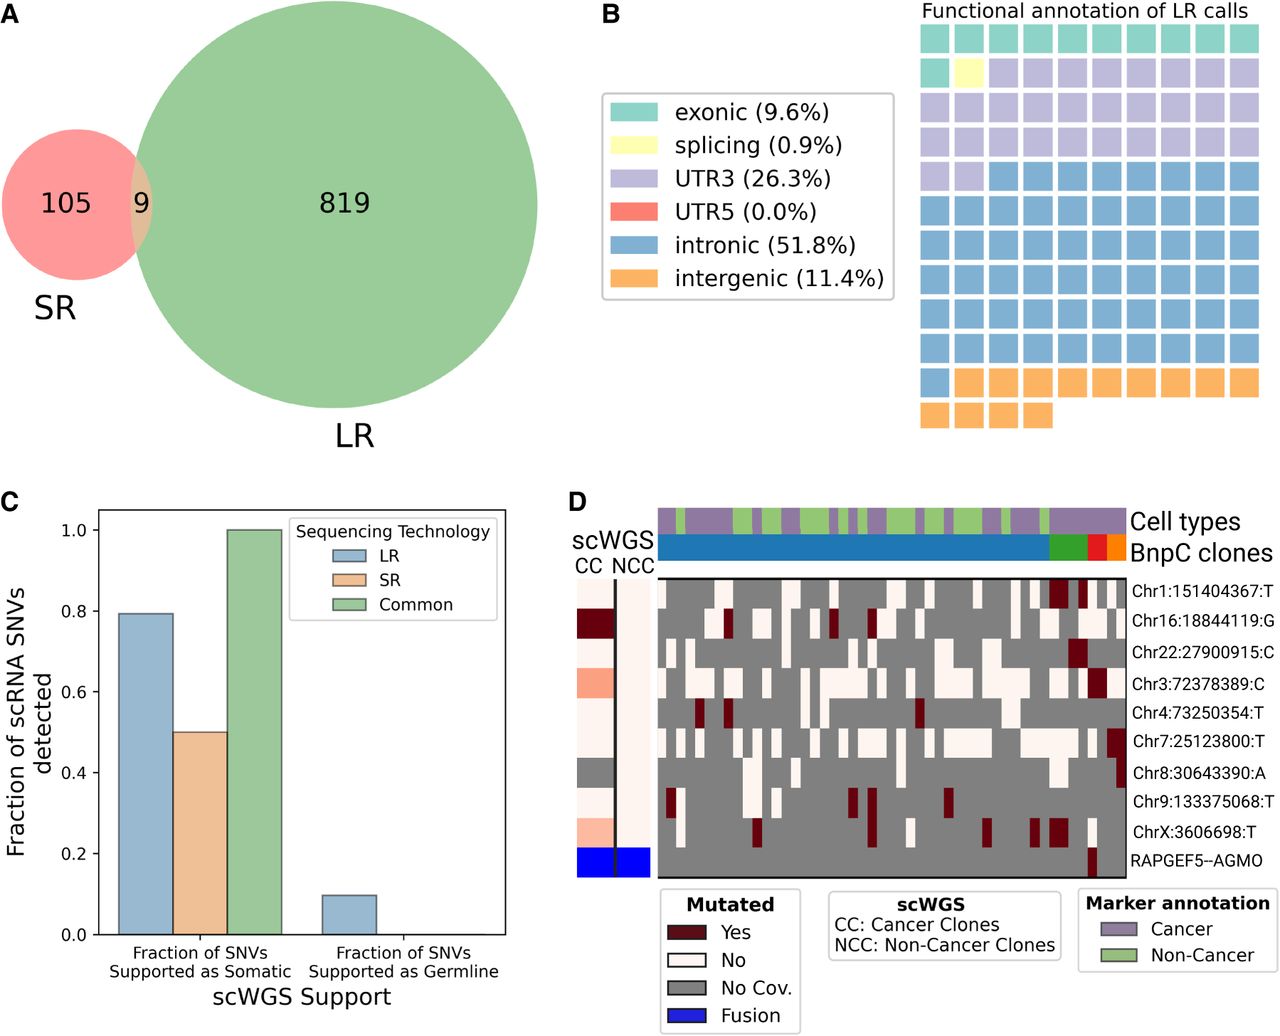
Analysis of SR scRNA-seq data and comparison with LR data. (A) Venn diagram of the intersection between SR (SComatic) and LR (LongSom) somatic calls in LR scRNA-seq data from all patients aggregated. (B) Waffle plot representing each of the 114 somatic SNVs detected by SComatic in SR scRNA-seq data, colored by their RefSeq functional annotation. (C) Barplot of the fraction of all loci that is supported by scWGS data as either somatic or germline, colored by whether they were called in LR data, SR data, or both. (D) BnpC clustering of single cells from the tumor biopsy of patient P1 (columns) by somatic SNVs and fusions (rows) called in SR scRNA-seq data. Red indicates that a loci is mutated in a cell (bet-binomial P-value < 0.05), white that it is not, and gray indicates no coverage in the cell at a given locus. Rows are colored according to the mutation status of aggregated scWGS diploid (Noncancer Clones) or aneuploid (Cancer Clones) cells. Fusions appear in blue. Columns are colored from top to bottom by marker-based annotation and BnpC subclones inferred from somatic SNVs and fusions.


