
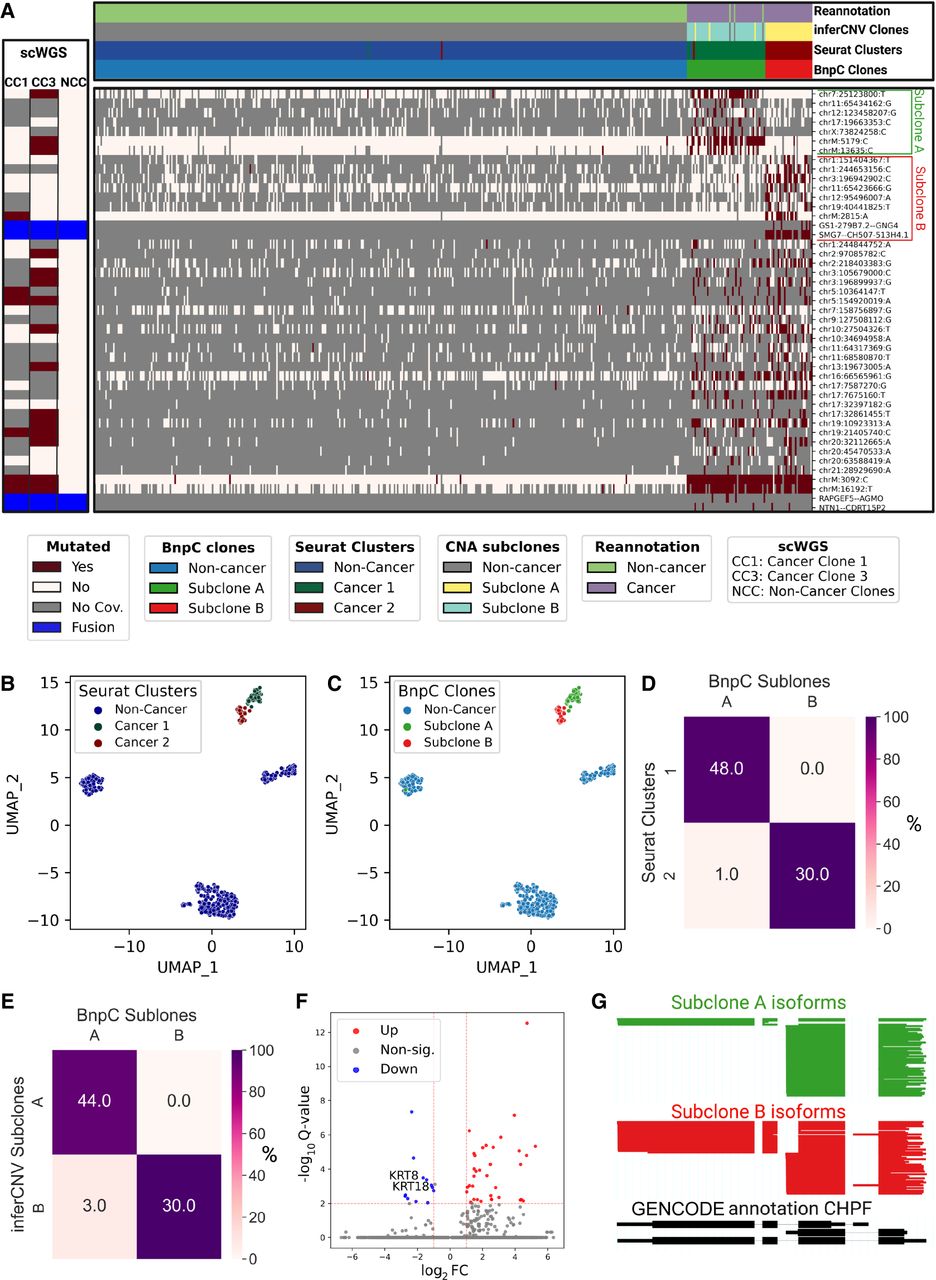
Analysis of intratumor heterogeneity using somatic variants detected in LR scRNA-seq in Patient P1. (A) BnpC clustering of single cells from the tumor biopsy of patient P1 (columns) by somatic SNVs and fusions called by LongSom in LR scRNA-seq data (rows). Red indicates that a loci is mutated in a cell (beta-binomial P-value < 0.05), white that it is not, and gray indicates no coverage in the cell at a given locus. Rows are colored according to the mutation status of aggregated scWGS diploid (Noncancer Clones) or aneuploid (Cancer Clones 1 and 3) cells. Fusions appear in blue. Columns are colored from top to bottom by cell types reannotated by LongSom, inferCNV CNAs subclones, expression clusters, and BnpC subclones inferred from somatic SNVs and fusions. (B,C) UMAP embedding of patient P1 gene expression data, colored by (B) Seurat clusters and (C) BnpC subclones. (D,E) Confusion matrix of cells in each expression-derived cancer cluster (rows) and (D) cells in the subclones inferred from BnpC, and (E) cells in the subclones inferred from inferCNV (columns), colored by the percentage of the total number of cells in each subclone and annotated by absolute numbers. (F) Volcano plot of differentially expressed genes identified between subclones B and A. Keratin genes downregulated in subclone B are annotated. (G) ScisorWiz representation of CHPF isoforms in subclones A and B. Colored areas are exons, whitespace areas are intronic space, not drawn to scale, and each horizontal line represents a single read colored according to subclones.


