
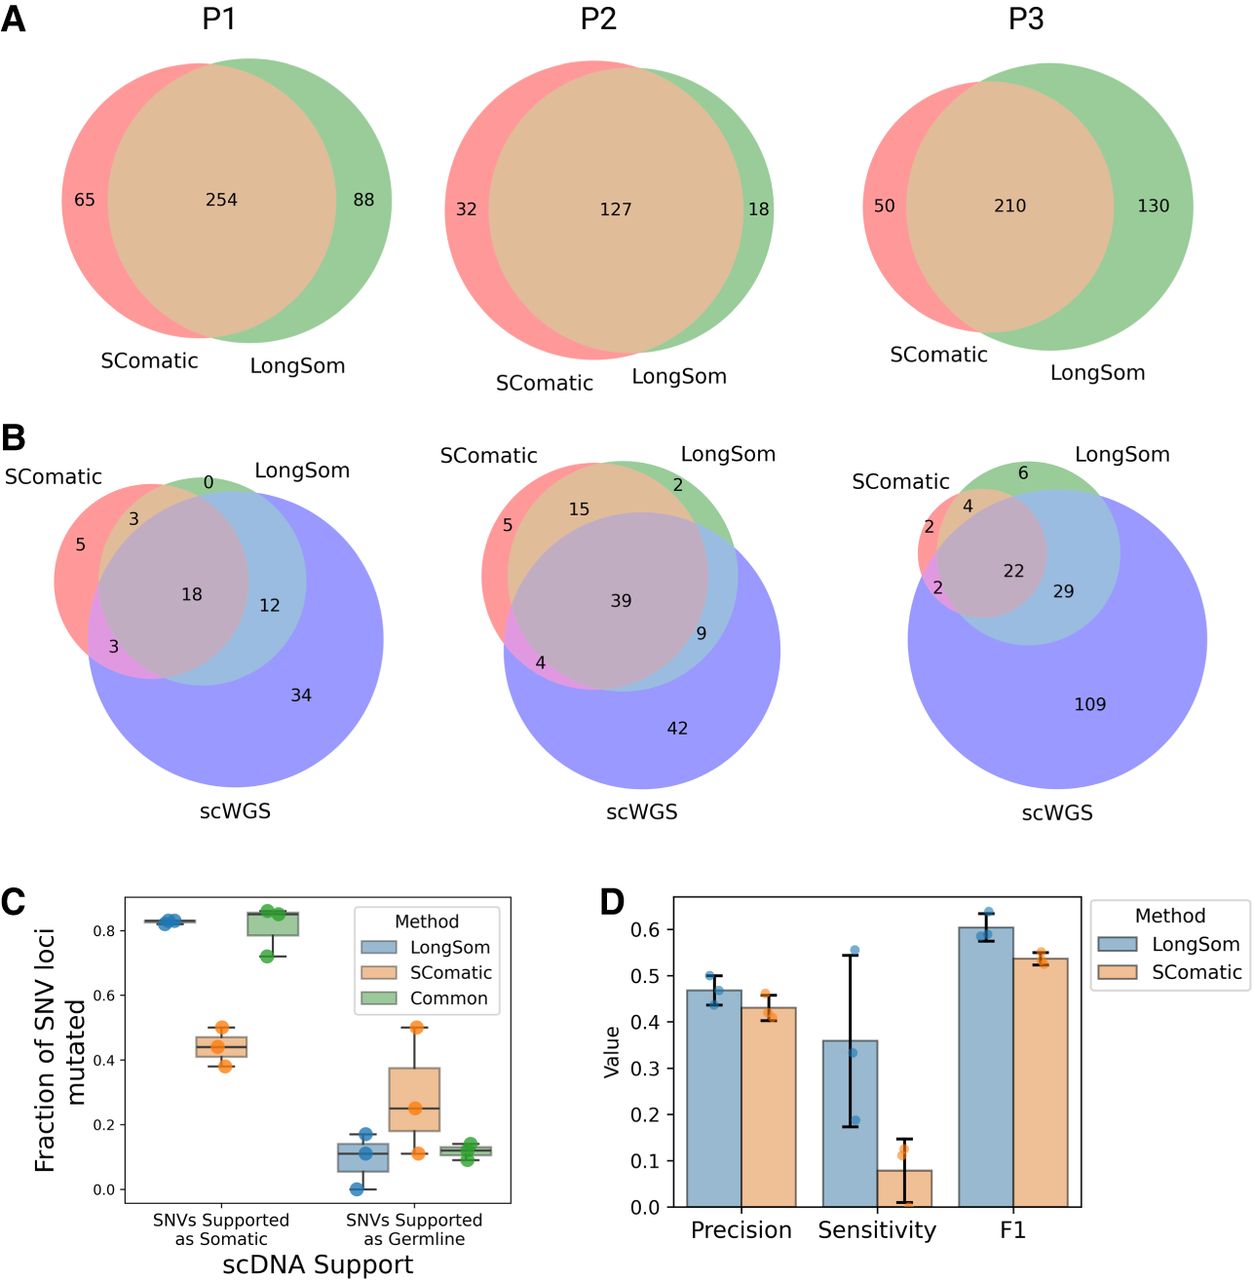
Comparison of LongSom versus SComatic performance using scWGS data. (A) Venn diagrams of the intersection between LongSom and SComatic somatic calls in LR scRNA-seq data from patients P1, P2, and P3. (B) Venn diagrams of the intersections between scWGS SNV calls. LongSom LR scRNA-seq calls and SComatic LR scRNA-seq calls. (C) Boxplot of all loci called after filtering step 9, colored by the distance from the closest mapping SNV also detected, and classified by somatic or germline scWGS support. Each point is a patient. (D) Performance of LongSom and SComatic for detecting somatic mutations in LR scRNA-seq data. Each point is a patient, the bars represent the mean value, and the error bars are the standard deviation for each statistic computed.


