
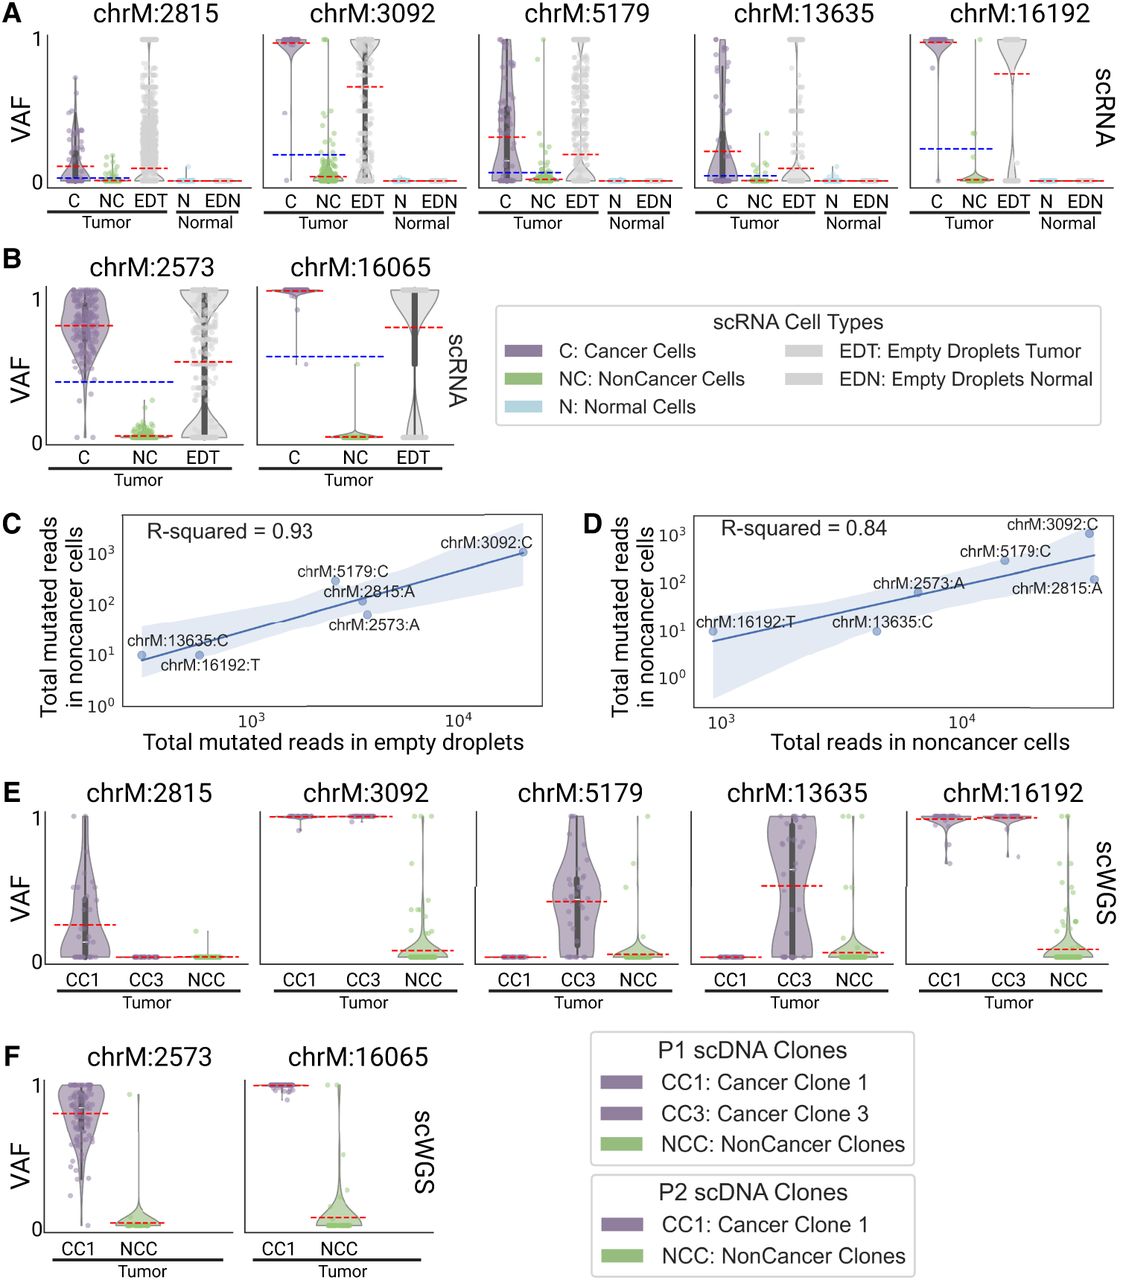
Mitochondrial reads harboring somatic mutations are detected in noncancer cells. (A,B) Violin plots of the VAF of each cell for (A) patient P1 and (B) P2 mtSNV loci in scRNA-seq data, categorized by reannotated cell types and empty droplets in tumor and normal biopsies. Individual points are cells or droplets. The blue dashed line represents the mean VAF in cells from the tumor biopsy. The red dashed line represents the mean VAF in each category. n refers to the number of cells with at least one read covering the locus. (C,D) Log aggregated mutated reads in noncancer cells, as a function of (C) log aggregated mutated reads in empty droplets and (D) log aggregated total reads in noncancer cells, for all loci from P1 and P2 except locus 16,065 in P2 which was discarded due to low expression. (E,F) Violin plots of the VAF of each cell for (E) patient P1 and (F) P2 mtSNV loci in scWGS data, categorized by clones in the tumor biopsy. Individual points are cells. The red dashed line represents the mean VAF in each clone. n refers to the number of cells with at least one read covering the locus.


