
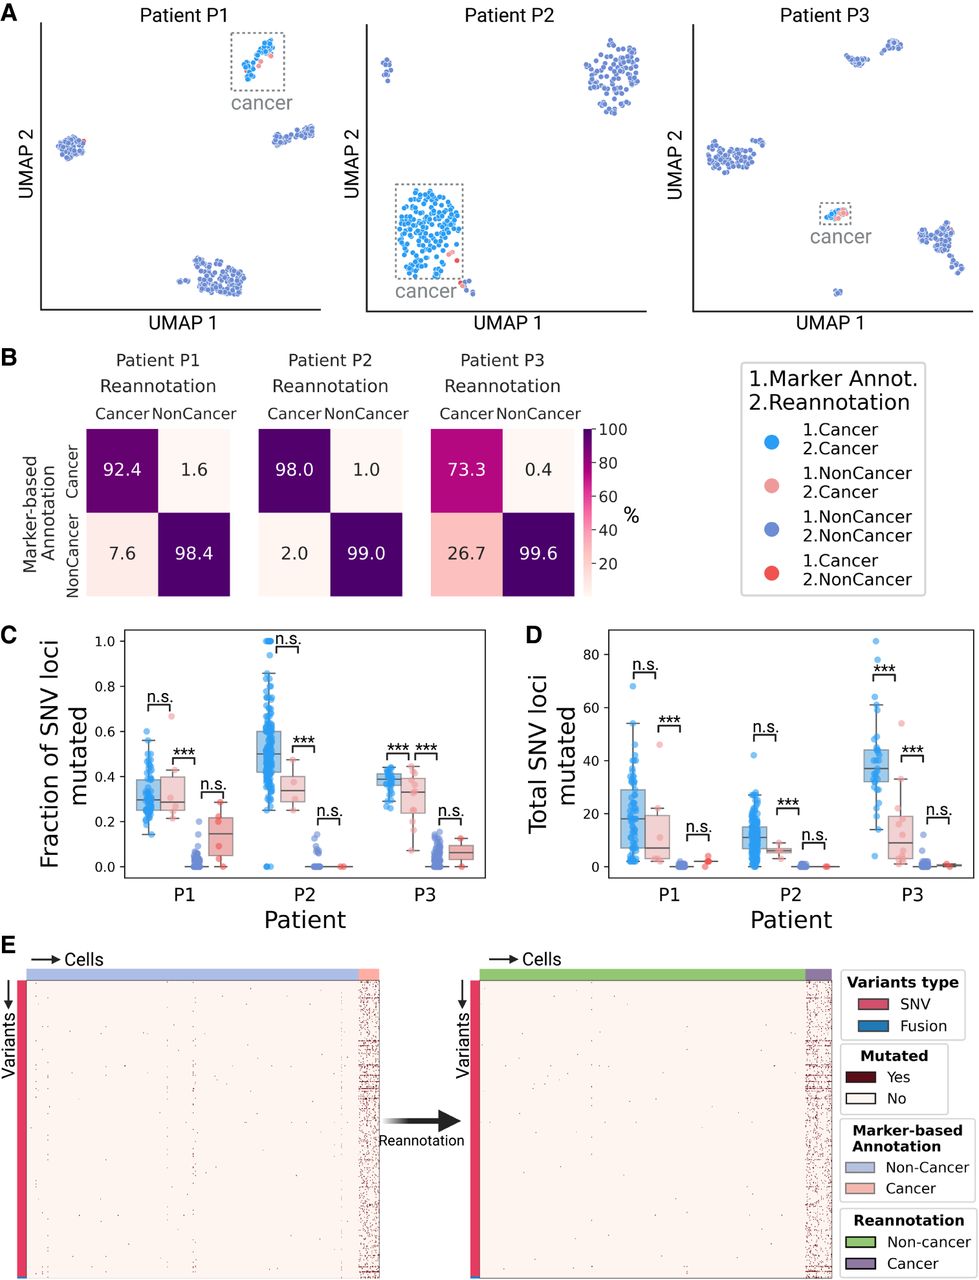
Validation of the cell type reannotation based on mutational profiles. (A) UMAP embeddings of LR scRNA-seq expression per patient. Cells are colored by annotation status; light-red cells were previously predicted as noncancer using marker gene expression-based annotation and were reannotated as cancer by LongSom based on high-confidence cancer variants. (B) Confusion matrices of cells predicted as cancer or noncancer using marker genes, and cells reannotated as cancer or noncancer by LongSom, colored and annotated by the percentage of the total number of cells in each category. For example, the bottom left square represents cells previously annotated as noncancer that were reannotated as cancer (false-negative cancer cells). (C,D) Boxplots of (C) the fraction of SNV loci that were found mutated in each cell, considering only loci with minimum coverage of one read at the locus in a cell, and (D) the total number of SNVs mutated in each cell, per patient, colored by their annotation status. Points represent individual cells, and boxes display the first to third quartile with the median as horizontal line, whiskers encompass 1.5 times the interquartile range. P values were calculated using Tukey–Krammer's test and are described with the following symbols: n.s: P > 0.05, (*) P ≤ 0.05, (**) P ≤ 0.01, (***) P ≤ 0.001. (E) Cell-variant matrixes of patient P3 before (left) and after (right) reannotation. Red indicates that a locus is mutated in a cell (bet-binomial test P-value < 0.05), and white that it is not (either P > 0.05 or no coverage).


