
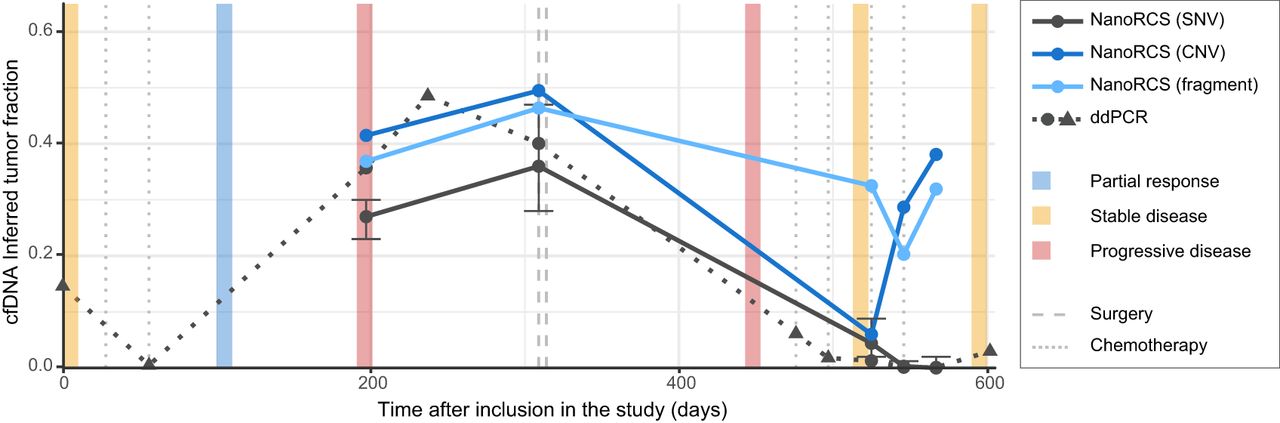
NanoRCS TFs of patient GCT02 during treatment. ctDNA fraction estimations in patient GCT02 were obtained using ddPCR (dotted line) and NanoRCS (solid lines); the three colors of solid lines represent the three modalities. A time period of 600 days after inclusion in the study is displayed. Circles represent samples that were analyzed using both ddPCR and NanoRCS, whereas triangles represent samples that were only assessed using ddPCR. Clinical events such as disease state (partial response, stable disease, progressive disease) are shown by colored blocks and interventions (surgery, chemotherapy) by vertical lines. Error bars for the SNV modality represent 95% confidence intervals.


