
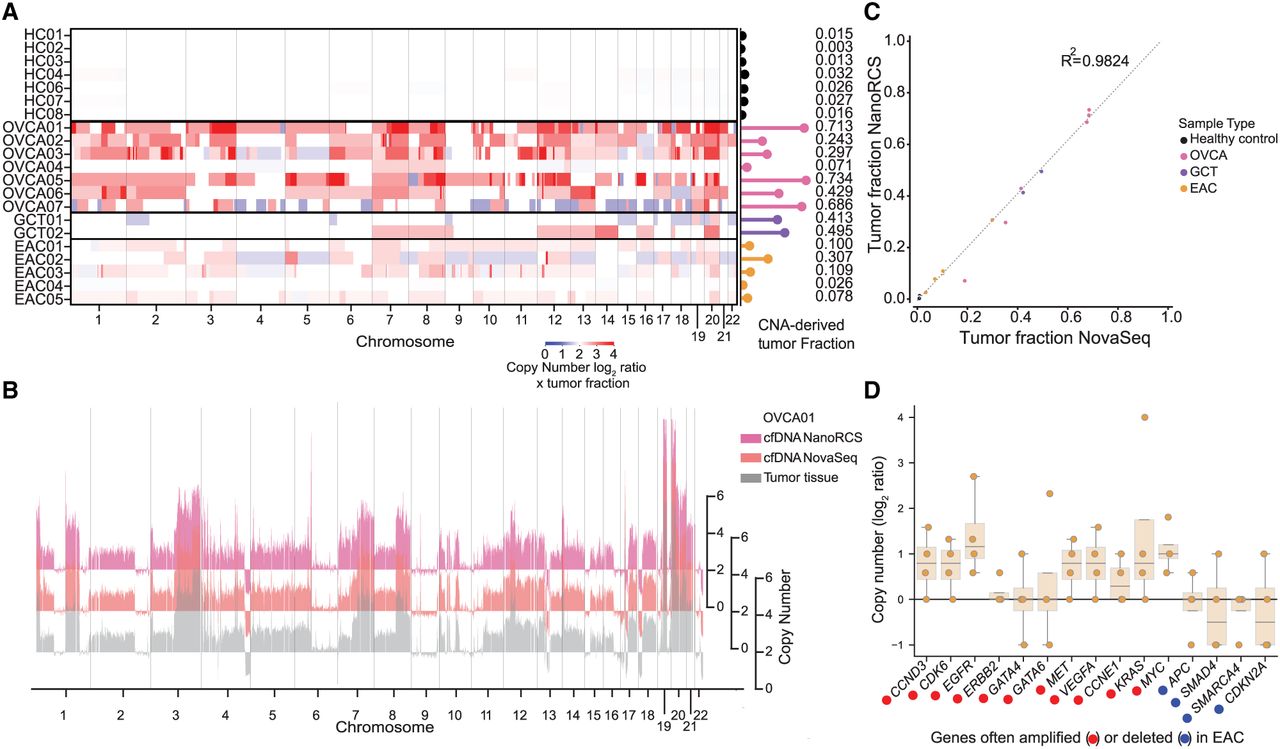
NanoRCS identifies CNA in cfDNA of tumor samples. (A) CNAs and derived TF (lollipops) for cfDNA samples across different sample types. (HC) healthy controls, (OVCA) ovarian carcinoma, (GCT) granulosa cell tumor, (EAC) esophageal adenocarcinoma. Tumor copy numbers were calculated by multiplying the copy number in the liquid biopsy by the TF in that liquid biopsy. Red indicates copy number gain and blue indicates copy number loss. Color intensity indicates the CNA multiplied by the TF in cfDNA. (B) The CNA profile, obtained using NanoRCS on cfDNA (pink), NovaSeq on cfDNA (orange), and from tumor tissue (gray), is concordant in patient OVCA01. The x-axis indicates the genomic position on the chromosomes (1 Mb bins), and the y-axis indicates copy numbers. (C) Correlation of CNA-derived TF between NanoRCS and NovaSeq. (D) NanoRCS copy number of genes often amplified (red) and deleted (blue) according to literature. The boxplots show the observed copy number distribution across the four EAC samples in this study. Each data point represents a single (EAC) sample.


