
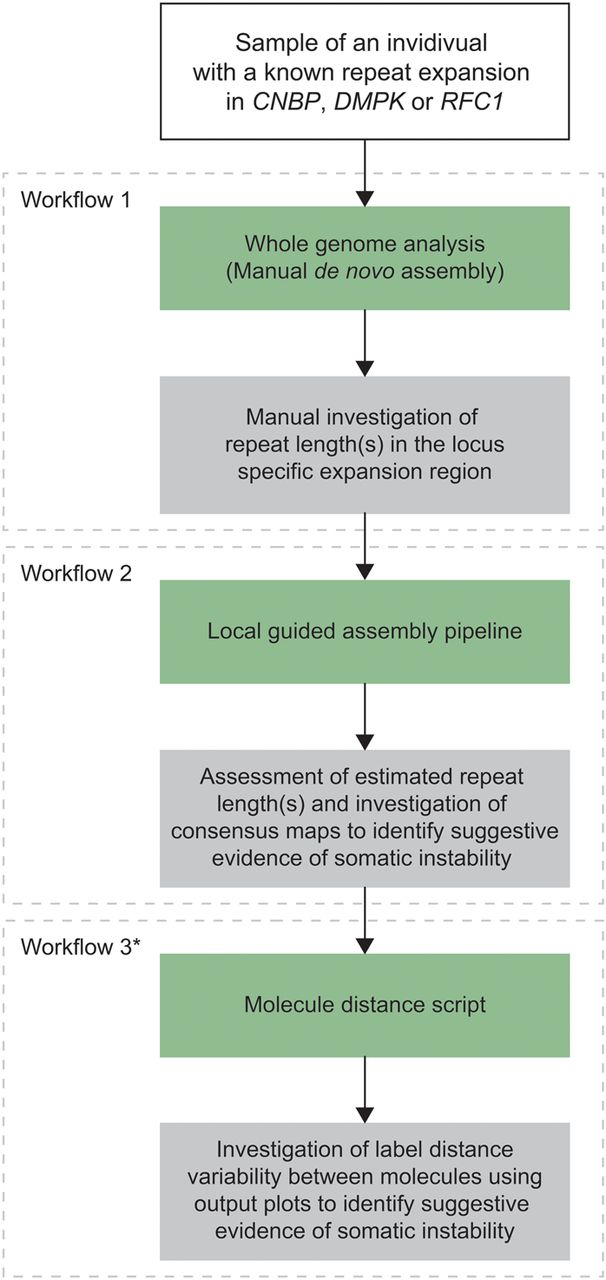
Figure 1.
Total overview of the data analysis workflow. For each sample, a de novo assembly was generated and the local-GA pipeline and molecule distance script were run. After each workflow, the maps and/or molecules to calculate workflow-specific repeat lengths were manually assessed. Green boxes denote the data analysis parts and gray boxes denote the data interpretation parts. (*) Workflows 1 and 2 were used to determine repeat lengths, while workflow 3 was used to identify potential somatic instability.


