
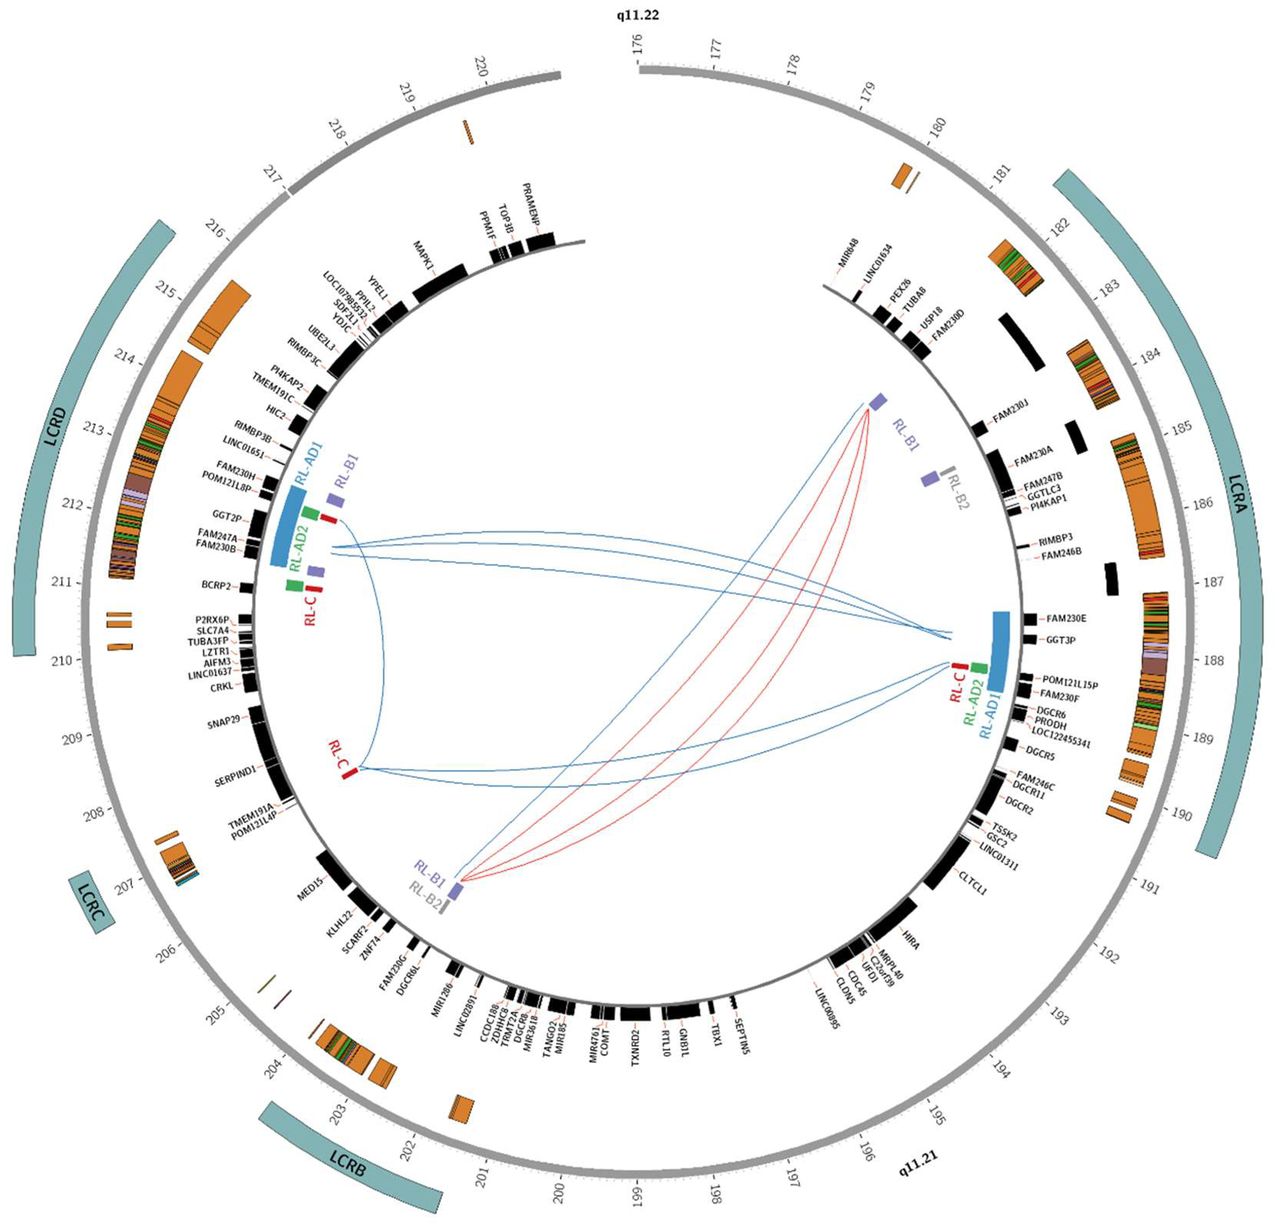
Figure 3.
Schematic visualization of 22q11.2 recombination breakpoints. The graph represents the 22q11.2 locus, its SDs, and known genes. Lines between LCR22s connect the proximal and distal breakpoint of a family-specific recombination. Solid red lines represent PATRR-mediated recombinations, and solid blue lines represent NAHR-mediated recombinations. The position of genes located in the involved recombination sequences is shown via blue or green vertical dotted lines.


