
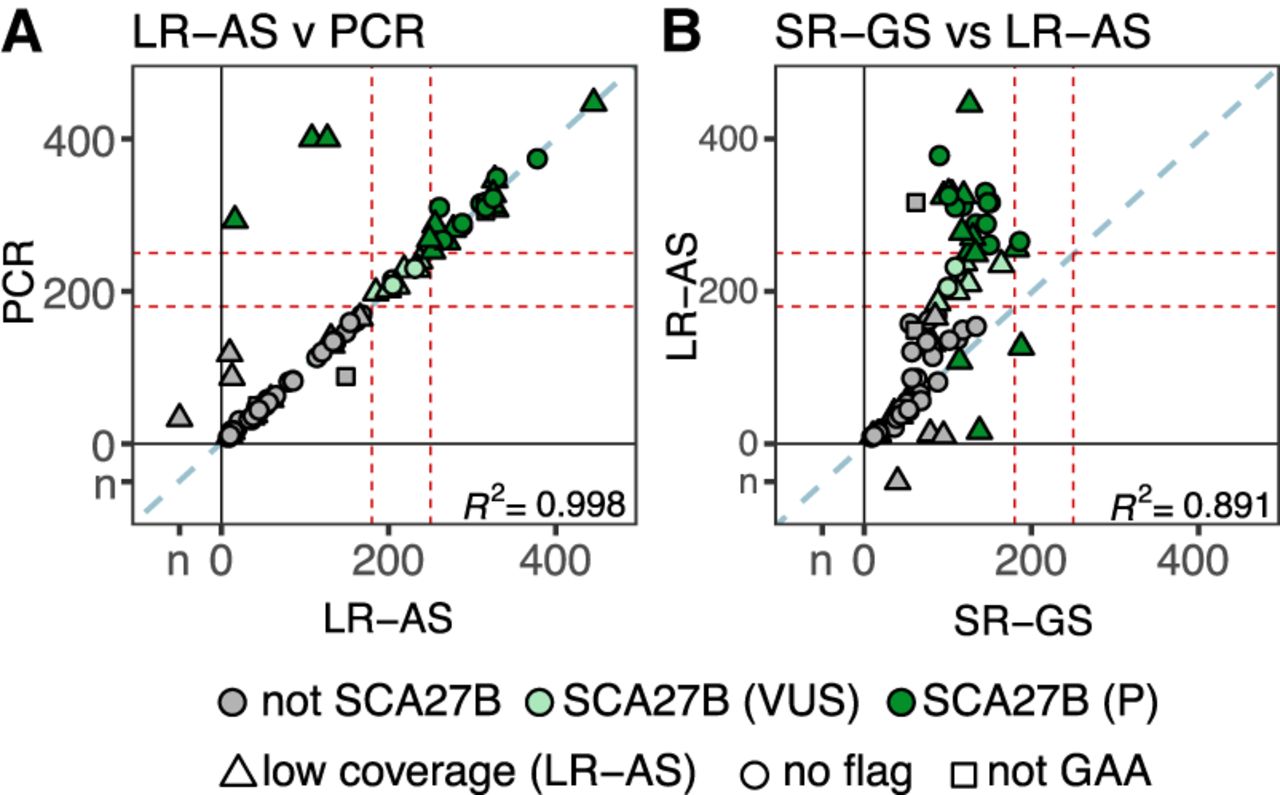
Comparison of FGF14 STR sizing between LR-AS, SR-GS, and PCR identifies the strengths of LR-AS. Comparison of FGF14 STR sizing is shown as concordance plots for (A). LR-AS compared to PCR and (B). LR-AS compared to SR-GS. The R2 is a Pearson's correlation. Dark green circles are individuals with a confirmed SCA27B diagnosis (P) and those in light green are SCA27B VUS. Triangles indicate low coverage (≤7 reads) on LR-AS, squares indicate non-GAA repeat motifs, and circles samples with coverage >7 reads and GAA motifs. The pathogenic (≥250 repeats) and VUS (≥180 repeats) thresholds are shown as dashed red lines. A 1:1 correlation is shown as a dashed blue line. The R2 is a Pearson's correlation. Individuals with no genotype call from either LR-AS, SR-GS, or PCR are indicated separately to the numbered axis and are labeled nc (i.e., no genotype call).


