
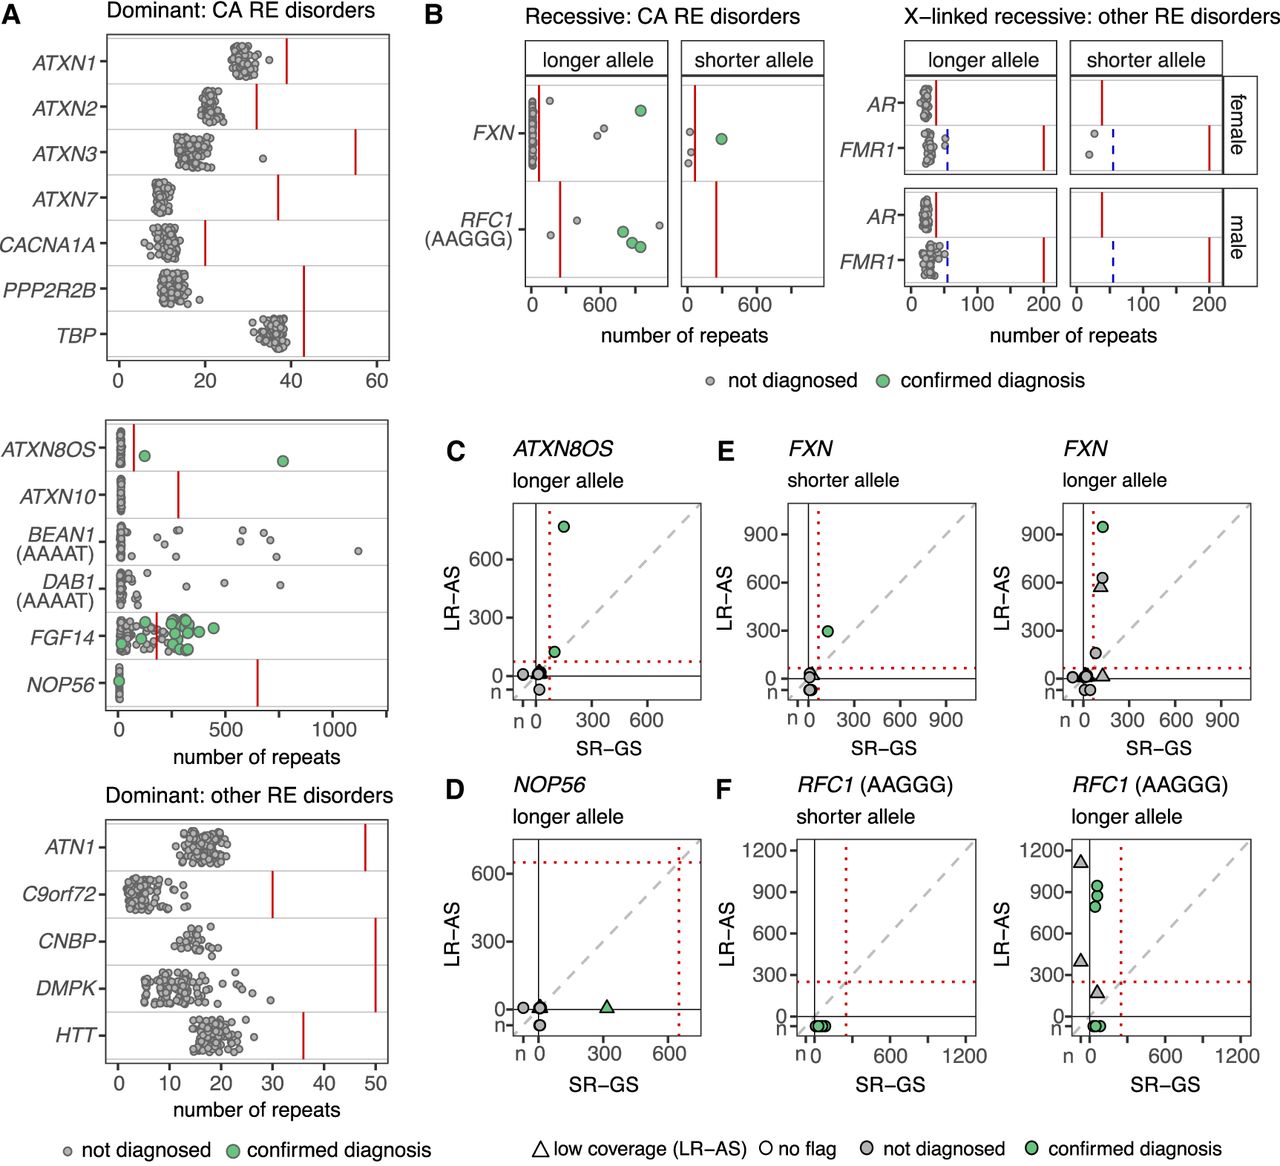
Targeted RE screening panel in LR-AS and comparison to SR-GS. STR genotypes were determined for short-listed loci with Straglr. Green points indicate individuals with a confirmed clinical diagnosis for the respective locus. (A) Genotypes are shown for the longer allele in dominant RE disorders that cause ataxia (top 2 plots, loci separated based on maximum allele size) and those that cause other disorders (bottom). (B) Genotypes for the shorter and longer alleles are shown for autosomal recessive RE ataxia disorders (left) and X-linked recessive disorders other than ataxia, split by sex (right). Comparison of allele genotyping with SR-GS and LR-GS is shown for loci with a confirmed diagnosis for the longer allele in dominant disorders. (C) ATXN8OS (SCA8), (D) NOP56 (SCA36), and for both alleles in recessive disorders for (E). FXN (FRDA) and (F). RFC1 (CANVAS, AAGGG motif only). LR-AS with low coverage (≤7 reads) are shown as triangles, those with no coverage issues flagged (>7 reads) are shown as circles. Green circles indicate individuals with an expansion in the respective allele that is larger than the pathogenic threshold (solid or dashed red line). Benign AAAAT motifs do not have a threshold. For FMR1, the blue dashed line indicates the threshold for FXTAS while the solid red line is the threshold for FXS.


