
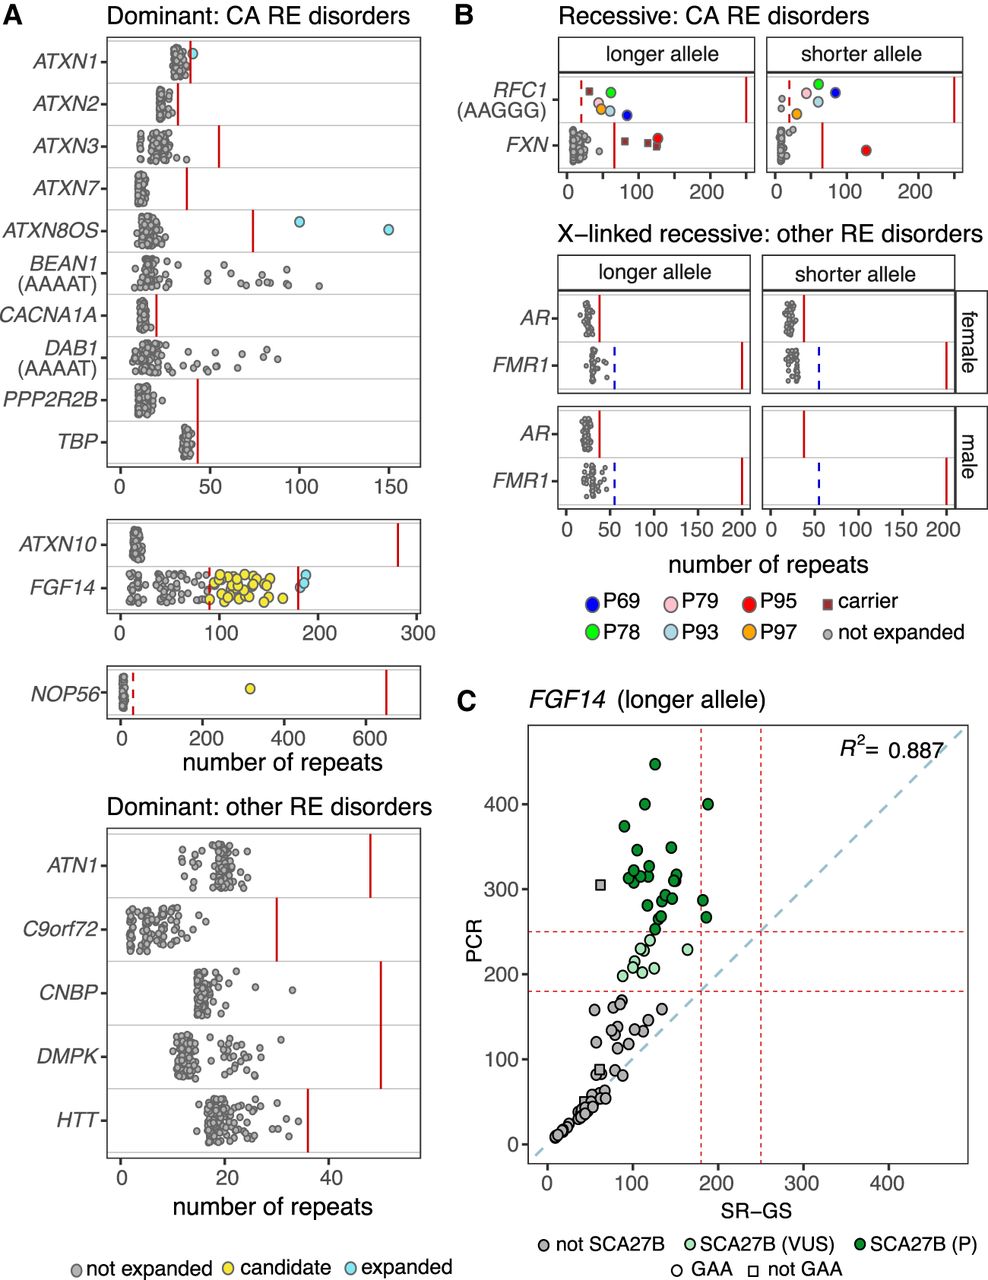
Targeted RE screening in SR-GS identifies potential RE diagnoses. STR genotypes were determined for the 22 loci associated with CA (Table 1) with EH5. (A) Genotypes are shown for the longer allele in dominant RE disorders that cause ataxia (top 3 plots, loci separated based on maximum allele size) and those that cause other disorders (bottom). Blue circles indicate individuals with an expansion in the respective allele that is larger than the pathogenic threshold (solid red line), while yellow circles are individuals who exceed an EH5-specific threshold (dashed red line) and are candidates for further investigation. Benign AAAAT motifs do not have a threshold. (B) Genotypes for the shorter and longer alleles are shown for autosomal recessive RE ataxia disorders (top) and X-linked recessive disorders other than ataxia, split by sex (bottom). Individuals who are heterozygous carriers for an allele expanded beyond the pathogenic threshold (solid red line) or an allele larger than the EH5-specific threshold (dashed red line) are shown as brown squares. For FMR1, the blue dashed line indicates the threshold for FXTAS while the solid red line is the threshold for FXS. Individuals who carry two alleles expanded beyond either the pathogenic or EH5-specific threshold are shown as colored circles. (C) Concordance plot showing a comparison of the FGF14 STR EH5 genotypes from SR-GS compared to PCR sizing (longer allele only). The pathogenic (≥250 repeats) and VUS (≥180 repeats) thresholds are shown as dashed red lines. A 1:1 correlation is shown as a dashed blue line. The R2 is a Pearson's correlation. Dark green circles are individuals with a confirmed SCA27B diagnosis and those in light green are SCA27B VUS. Circles indicate GAA motifs and squares are non-GAA motifs, determined by observation in IGV.


