
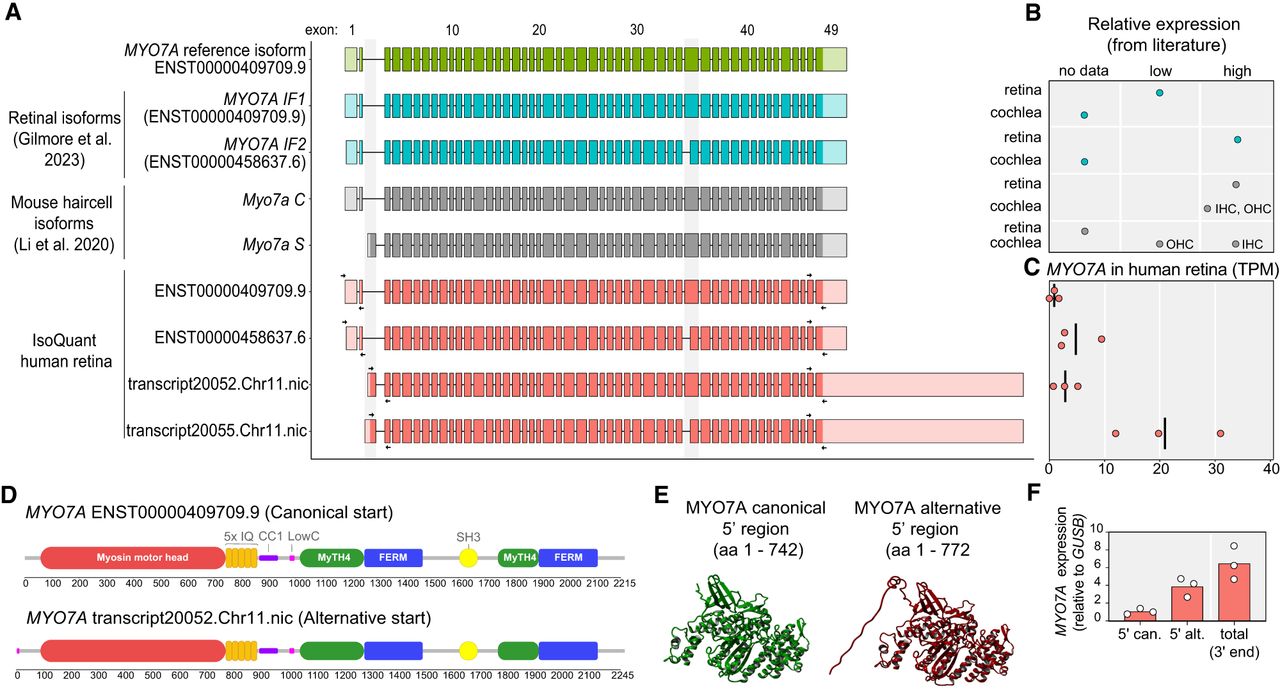
MYO7A transcripts identified by IsoQuant analysis compared to known isoforms from the literature. (A) The GENCODE reference transcript is depicted at the top in green, followed by the known human MYO7A transcript isoforms in blue (Gilmore et al. 2023) and the murine isoforms in gray (Li et al. 2020). The MYO7A IsoQuant transcripts are depicted in red. The light green, blue, gray, and red colors indicate the UTR and the dark green, blue, gray, and red colors indicate the open reading frame (ORF) of each transcript. Differences between the IsoQuant transcript isoforms and the GENCODE reference transcript are highlighted in gray boxes. (B) Relative expression of MYO7A isoforms based on literature in either the retina or the cochlea. (C) The TPM (based on data set 1) for each IsoQuant isoform are presented for the three individual samples. (D) The predicted 2D protein domain architecture of the MYO7A protein isoforms with the canonical 5′ start and the alternative 5′ start from transcript20052.Chr11.nic. The bar below the 2D protein structures displays the amino acid positions. (IQ) isoleucine–glutamine motif, (CC1) coiled-coil domain, (LowC) low complexity region, (MyTH4) myosin tail homology 4, (SH3) SRC homology 3 domain. (E) AlphaFold2 3D protein predictions of the MYO7A protein isoforms, modeled from the 5′ start to the end of the Myosin motor head domain. (F) RT-qPCR analysis of the relative expression of the MYO7A canonical 5′ start site, the alternative 5′ start, and the 3′ end is shown. The locations of the primers for this RT-qPCR are indicated with the arrows on top of the IsoQuant isoforms in Figure 3A.


