
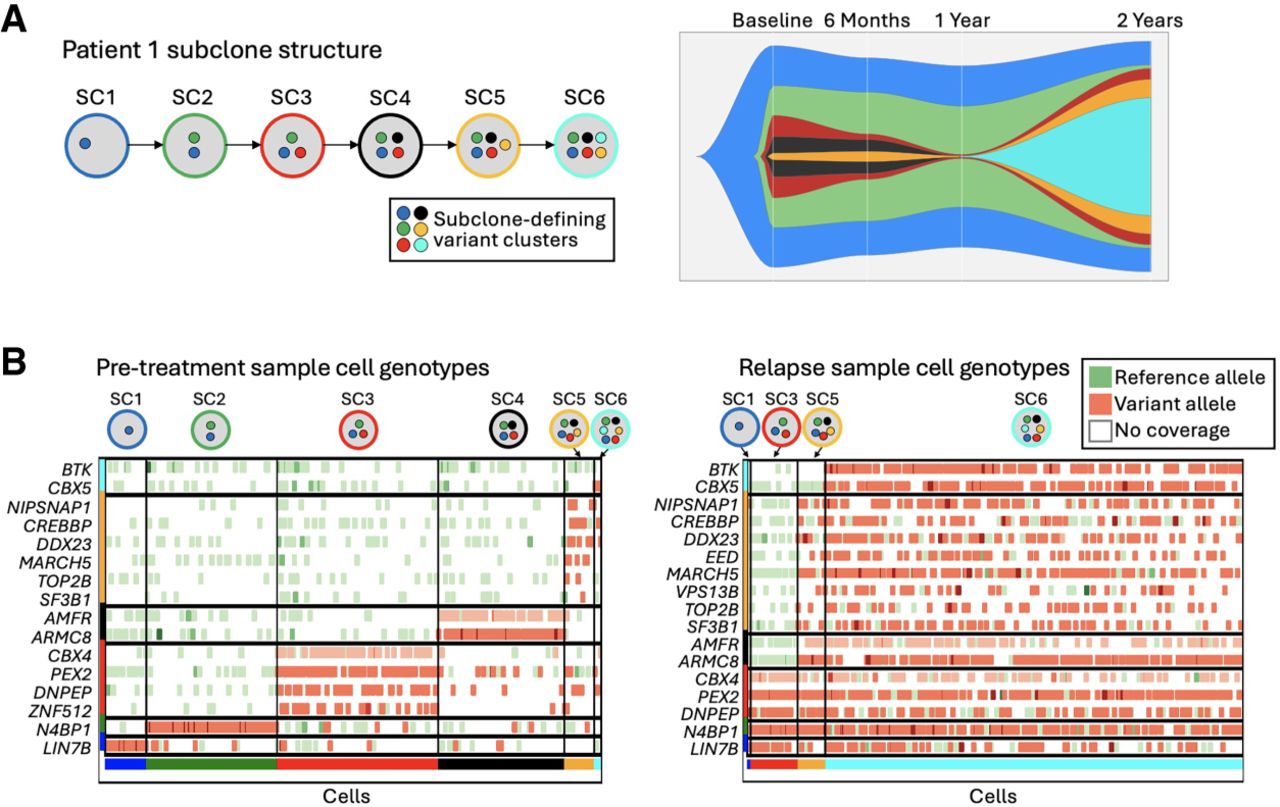
Visualization of single-cell genotypes to identify subclone structures. (A) The subclone structure of patient 1 was identified in the bulk DNA sequencing data. Subclones are depicted by the colored circles, with representative variant clusters inside each circle. The fishplot shows the prevalence of each subclone throughout treatment. (B) The cell genotypes at subclone-defining variants in patient 1. Each cell that was successfully assigned to a subclone is shown (x-axis), along with every somatic variant that was present in the WES data, labeled with the gene that the variant belongs to (y-axis). Green markers represent only reference alleles present in the scRNA-seq reads at the given variant location within the cell, and red markers indicate at least one scRNA-seq read in the cell contains the somatic variant allele. Darker marker coloring indicates an increased number of reads supporting that genotype. Variants and cells are grouped by their subclone assignment.


