
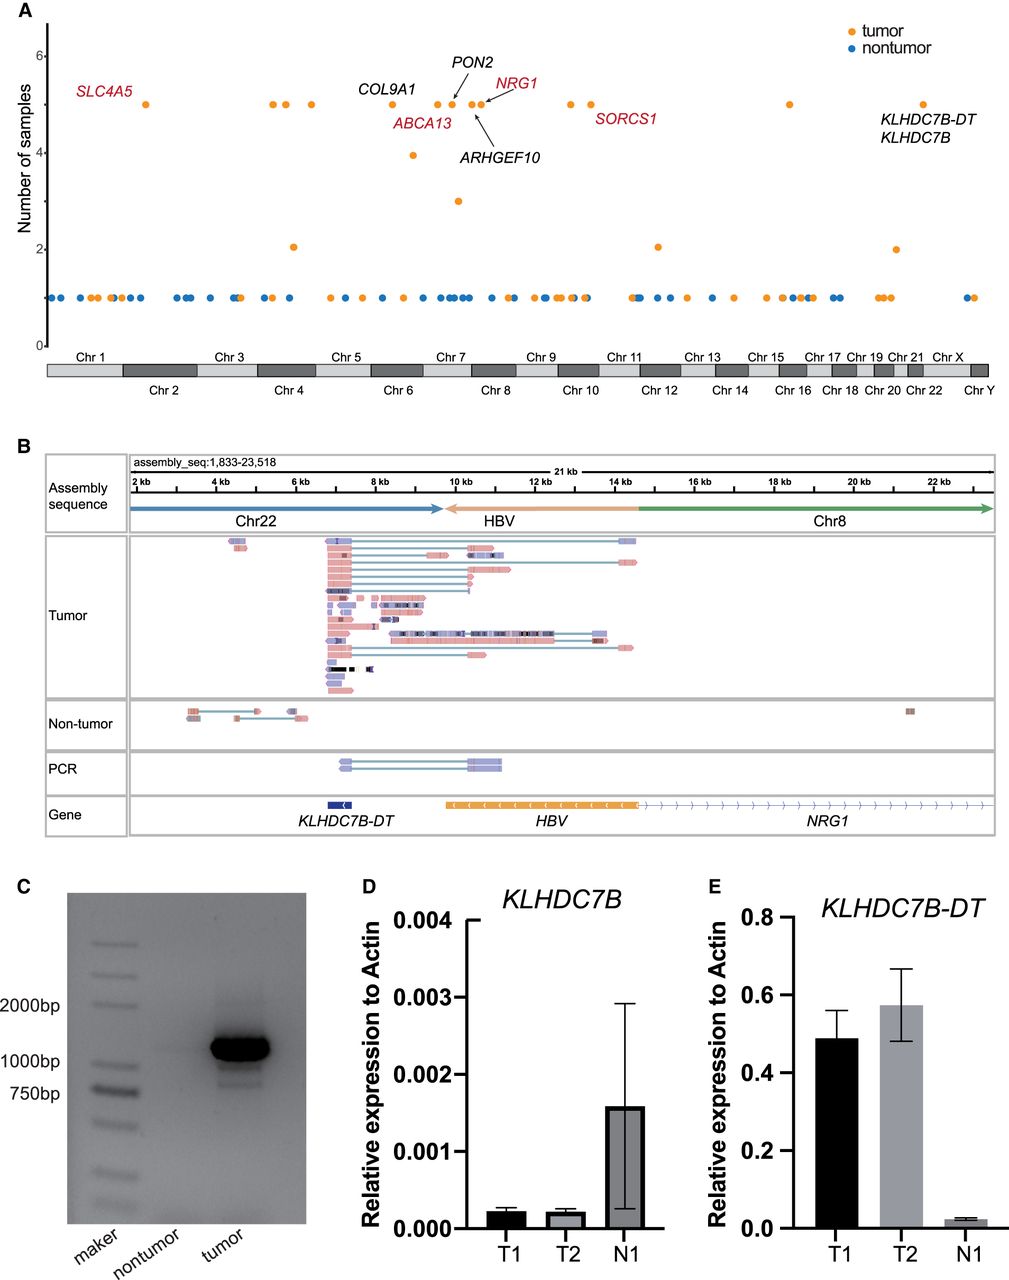
Genes disrupted by HBV-induced SVs. (A) Manhattan plot showing the genes affected by HBV-induced SVs. Tumor samples are represented by orange points, and adjacent nontumor samples are represented by blue points. Tumor genes annotated by COSMIC or NCG6 are marked in red. (B) IGV plot depicting the fusion transcript formed between the KLHDC7B-DT gene and the HBV DNA sequence. The top track represents the assembled TRA sequence, and the bottom track illustrates gene annotations for the TRA sequence. The middle tracks include long-read RNA-seq from both tumor and adjacent nontumor samples, and Sanger sequencing reads for the fusion transcript PCR product. (C) The PCR products of fusion transcript were detected by agarose gel electrophoresis. (D) The relative expression levels of KLHDC7B determined using RT–PCR in samples with and without the HBV-induced TRA. (E) The relative expression levels of KLHDC7B-DT determined using RT–PCR in samples with and without the HBV-induced TRA.


