
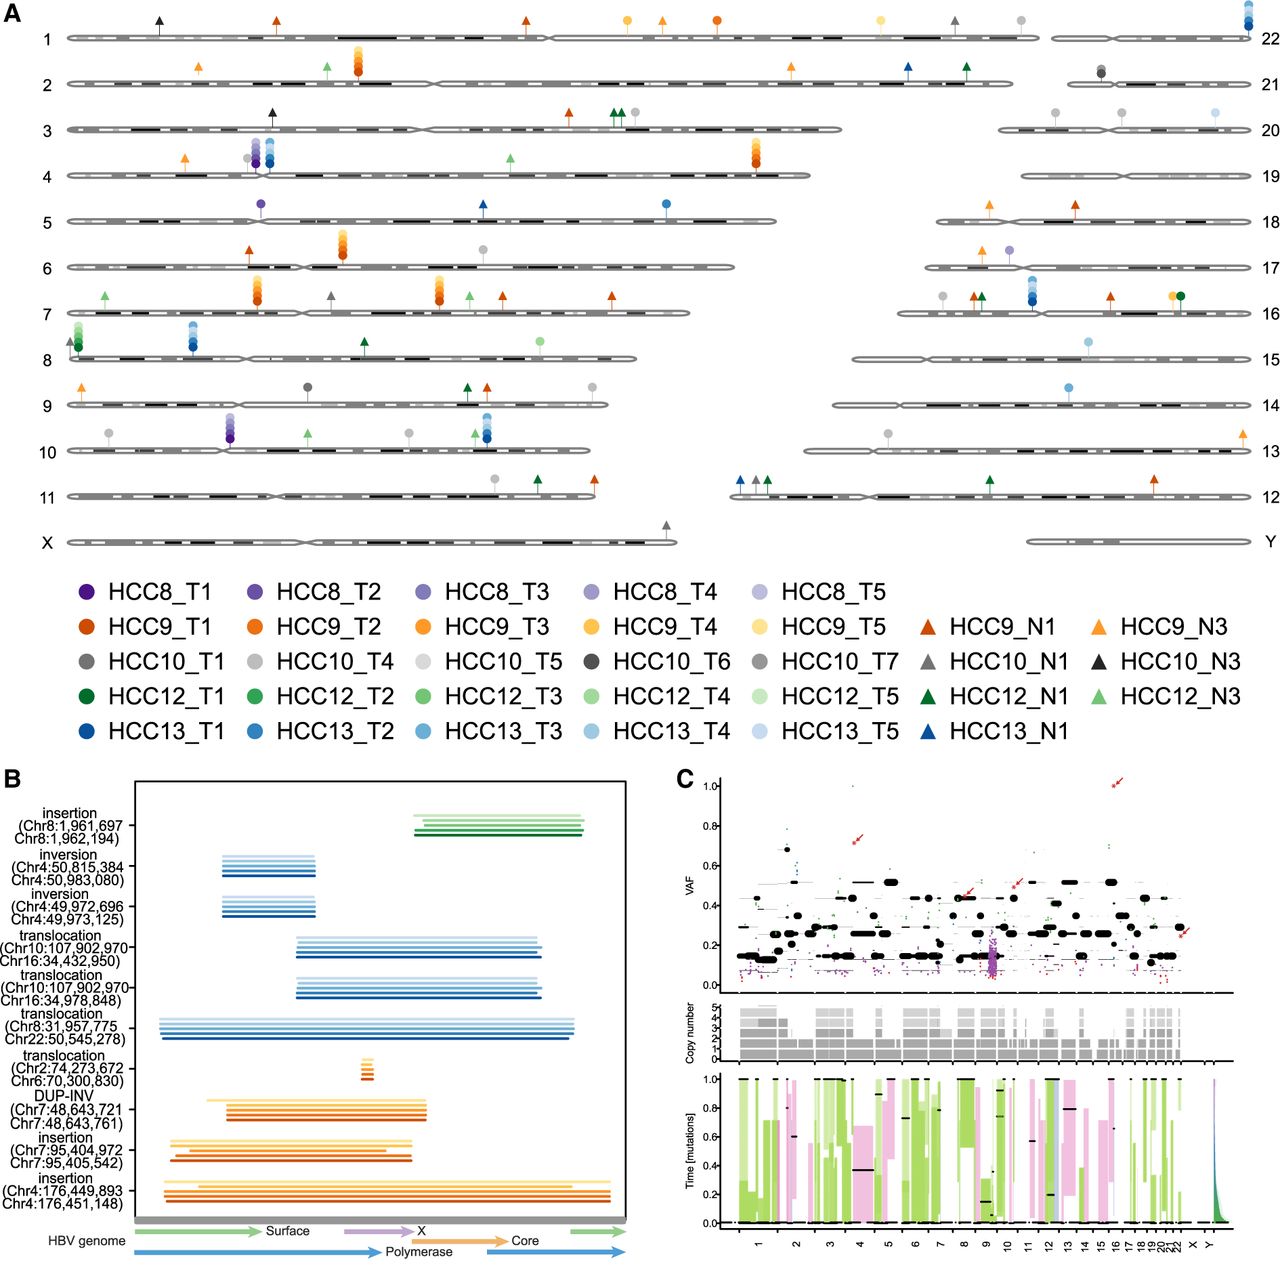
Integration breakpoints of HBV DNA in human and HBV genomes. (A) Integration breakpoints of HBV DNA within the human genome. The same color scheme represents the same patient. Circular points represent tumor samples, and triangular points represent adjacent nontumor samples. (B) A schematic diagram of shared HBV-induced SVs at all tumor sampling sites in the patients. The horizontal line represents the relative position of the integrated HBV sequence within the HBV genome. (C) In HCC13, the clonal status of HBV integration sites was in the context of somatic SVs (top panel), with green indicating early clonal events. The red asterisk symbol represents the shared HBV integration sites. The middle panel represents the CNV status, and the lower panel displays the inferred mutation timeline.


