
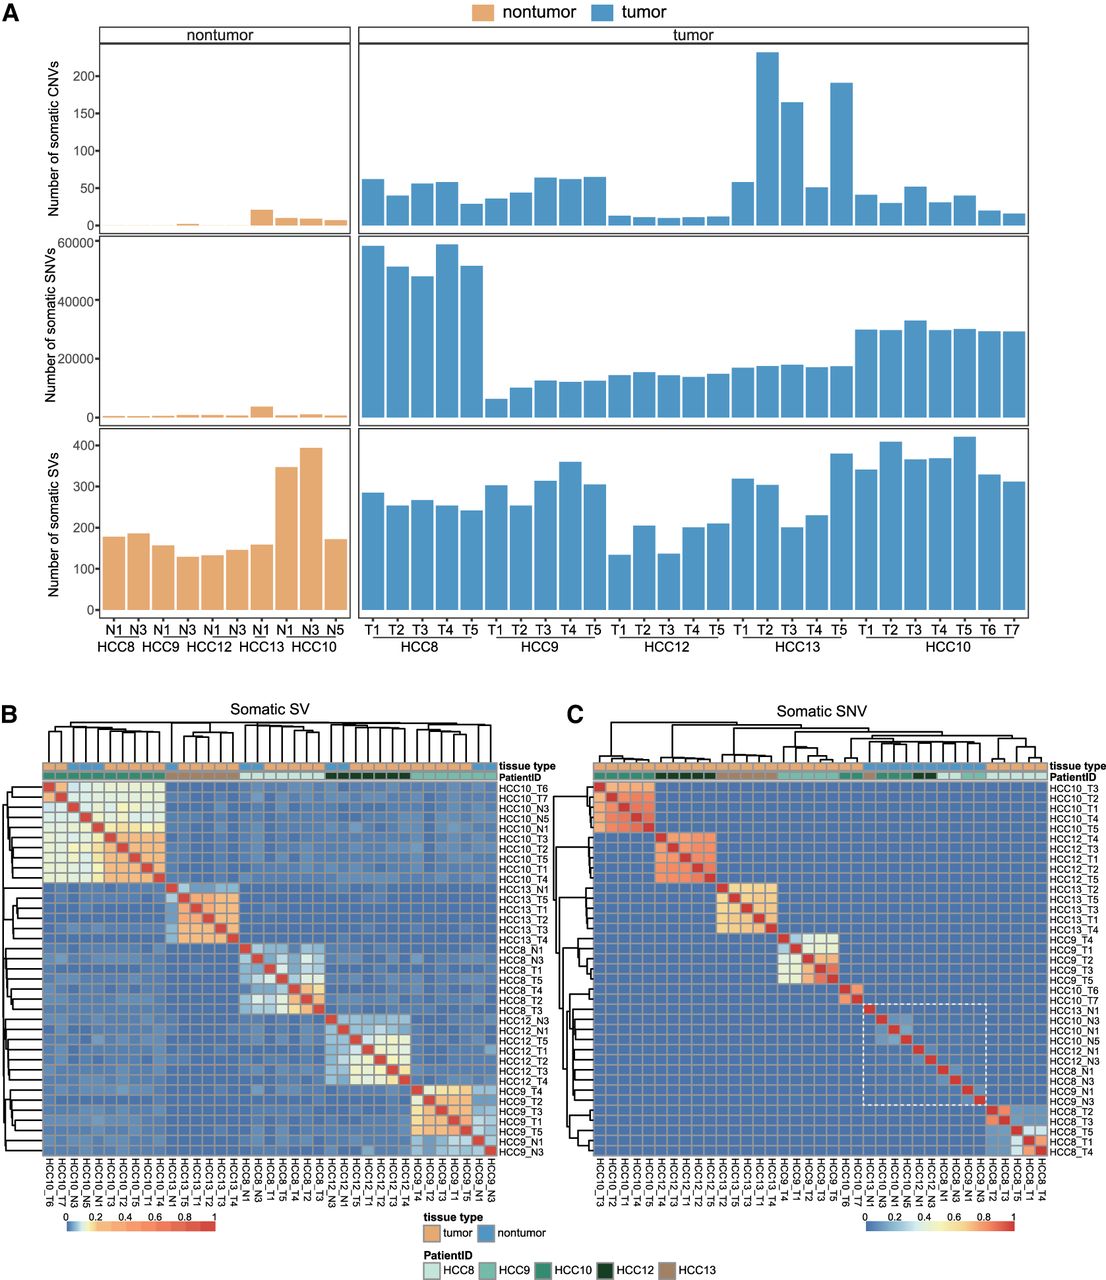
Figure 2.
Somatic SVs are prominent in adjacent nontumors. (A) Bar plots showing the number of somatic mutations (classified into SVs, SNVs, and CNVs) in adjacent nontumor and tumor tissues from all patients. (B) Heatmap depicting the hierarchical clustering of 37 tumor and adjacent nontumor samples based on Jaccard indexes calculated from somatic SVs. (C) Heatmap depicting the hierarchical clustering of 37 tumor and adjacent nontumor samples based on Jaccard indexes calculated from somatic SNVs. The white dashed box outlines a cluster consisting of adjacent nontumor samples.


